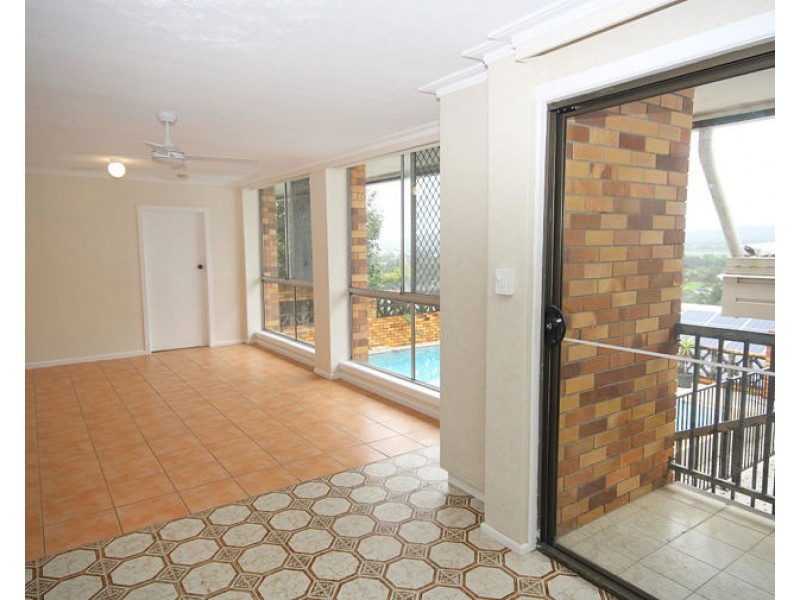
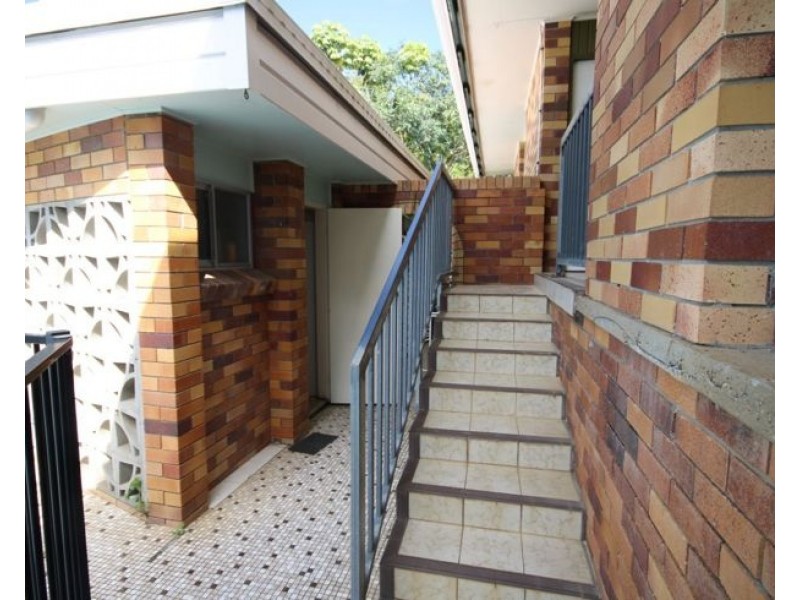
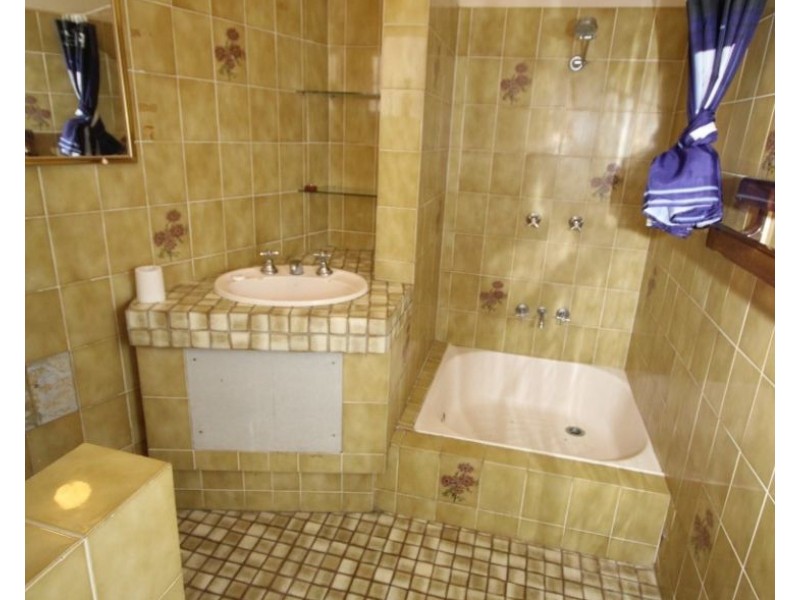
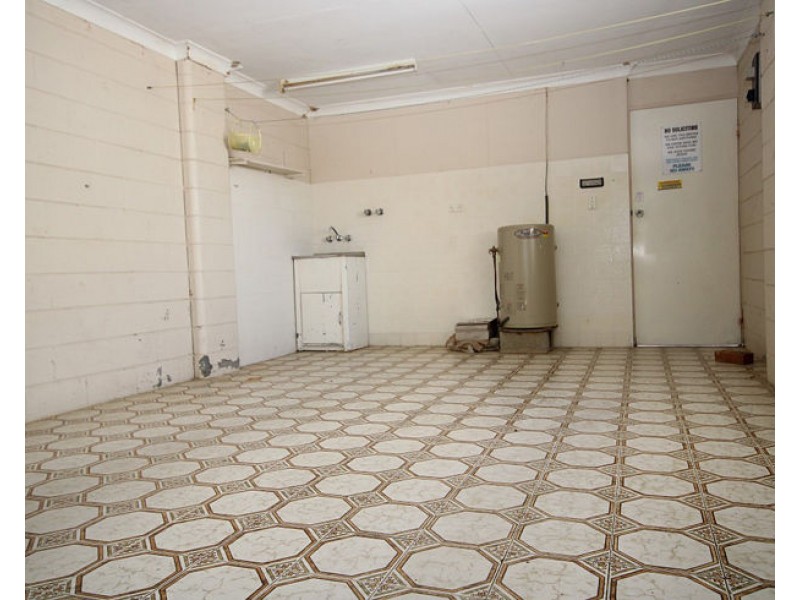
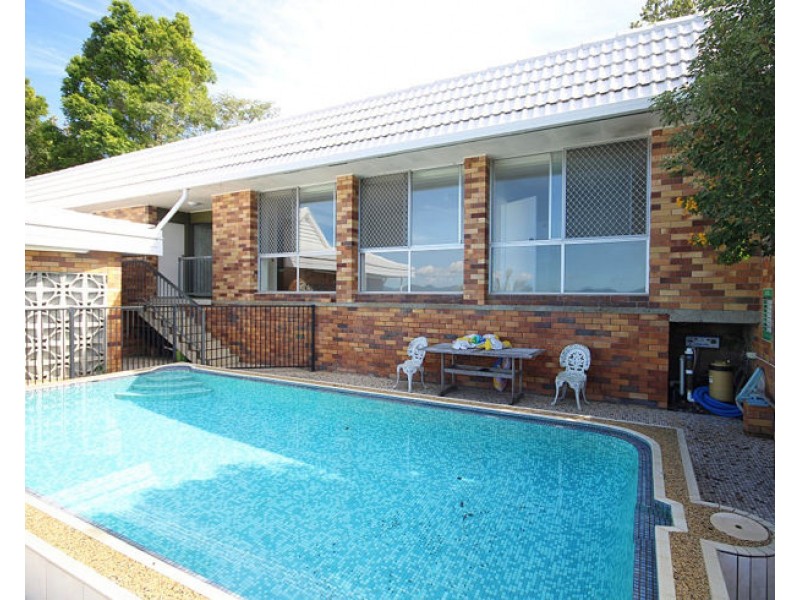
1/45 Eyles Ave, Murwillumbah NSW 2484 Serene Hilltop Location Deposit Received 1 1 1 Enquire Listing ID: 5248996 Other properties to rent near 1/45 Eyles Ave, Murwillumbah NSW 2484 88 Murwillumbah Street, Murwillumbah NSW 2484 Unit 2/5 Nullum Street, Murwillumbah NSW 2484 3 3 Church Lane, Murwillumbah NSW 2484 U6 3 Church Lane,, Murwillumbah NSW 2484 2A/23 Church Lane, Murwillumbah NSW 2484 Location Enquire Enquiry about this property Name* Email* Phone* Message* Send me regular newsletters from Homehound Have agents get in touch about similar properties within the area What is 8 + 20?* Receive email alerts for properties like this Email alerts Email* Send me regular newsletters from Homehound. Have agents get in touch about similar properties within the area What is 8 + 20?*