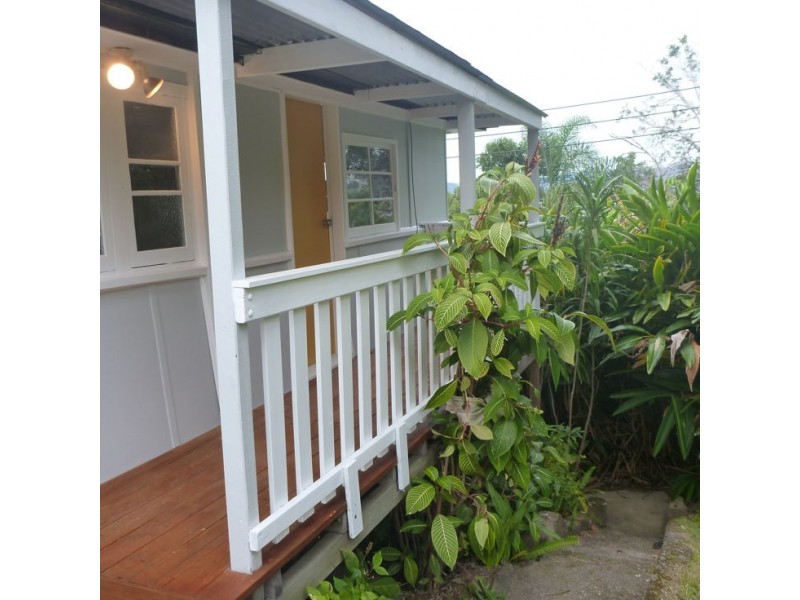
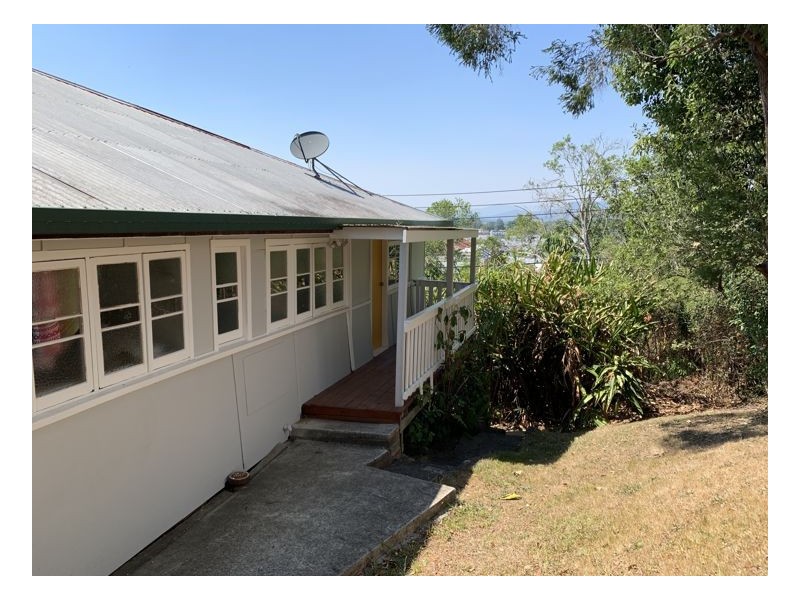
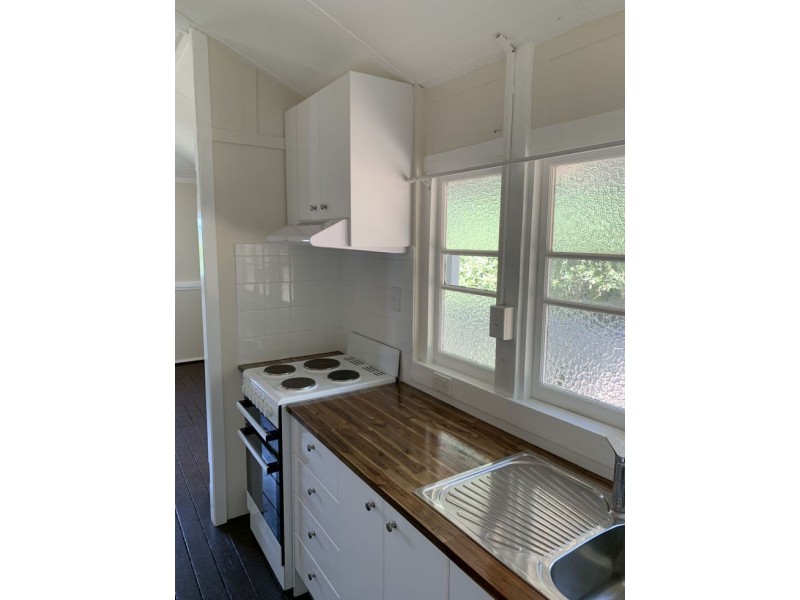
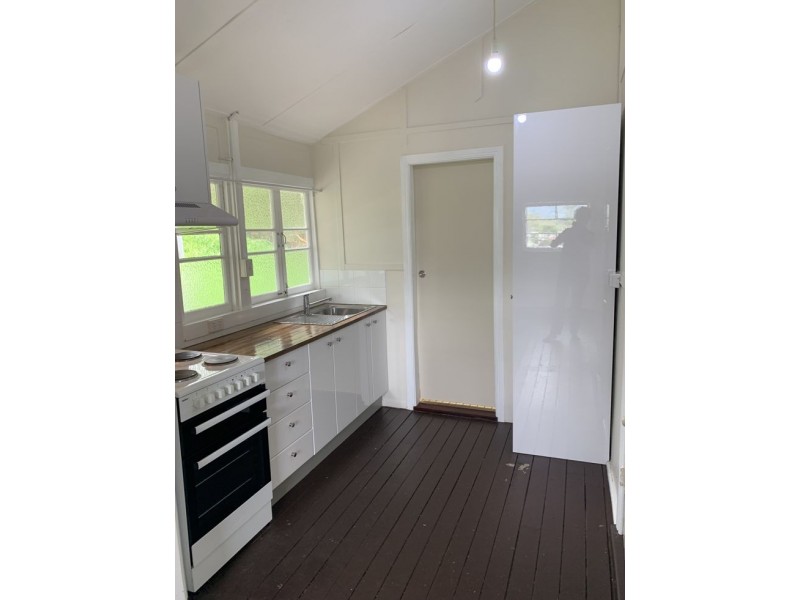
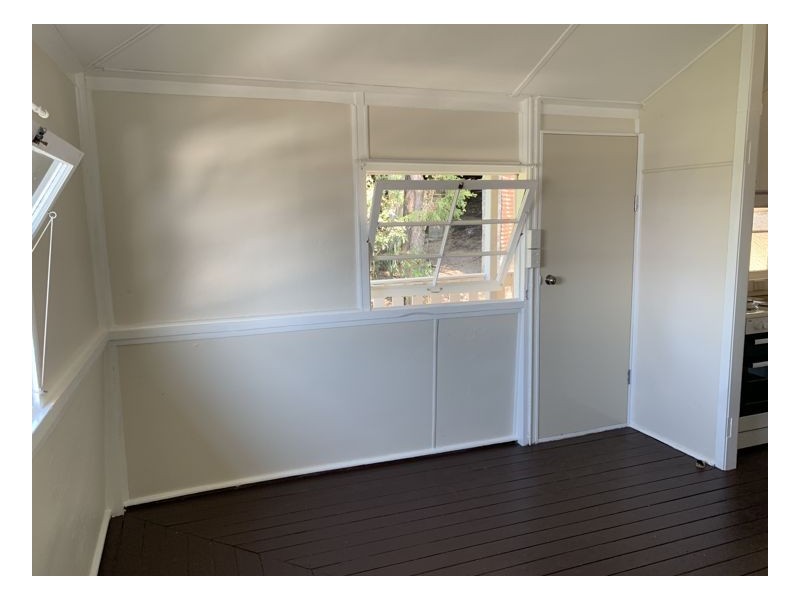
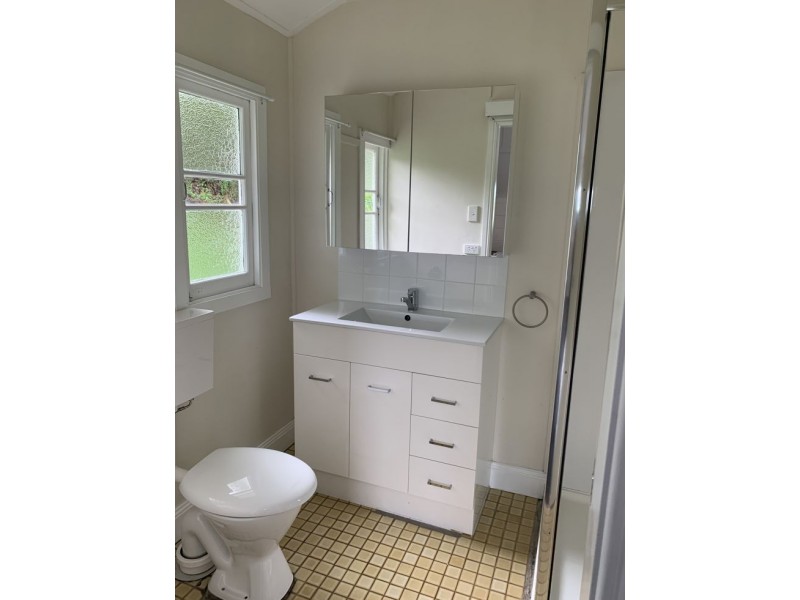
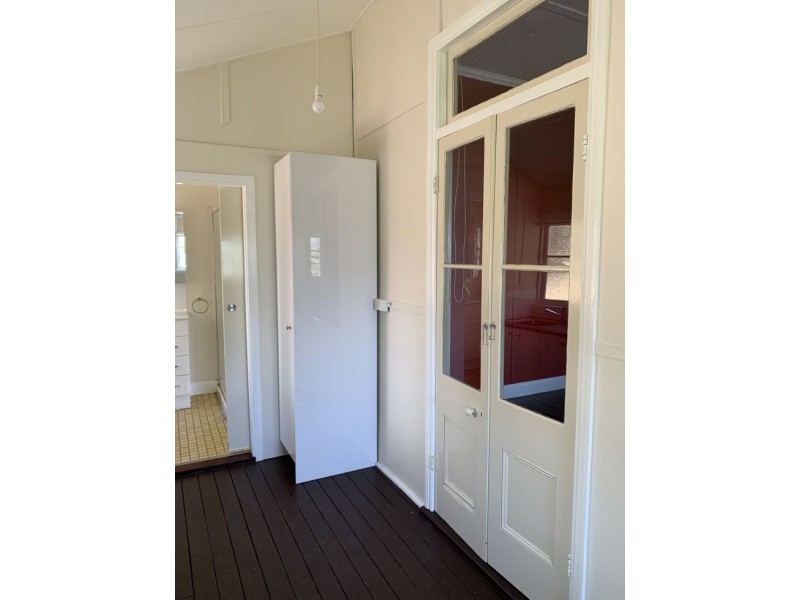
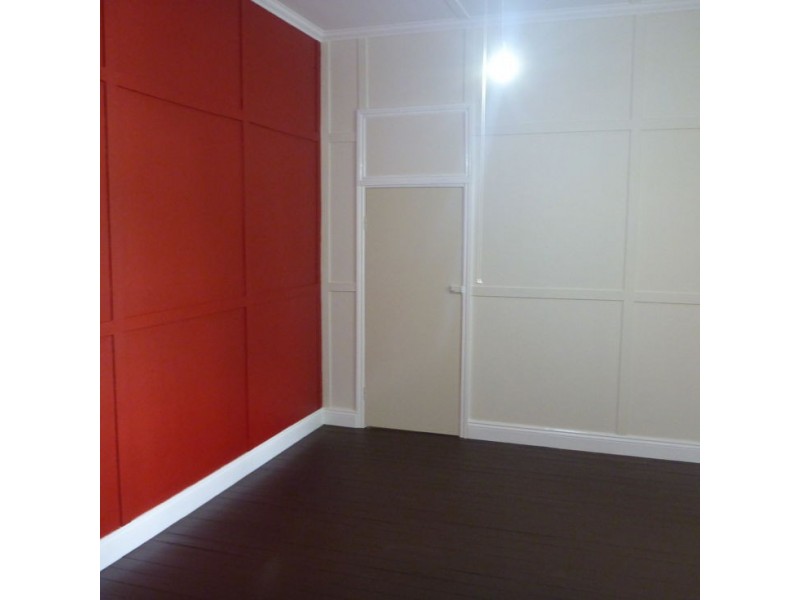
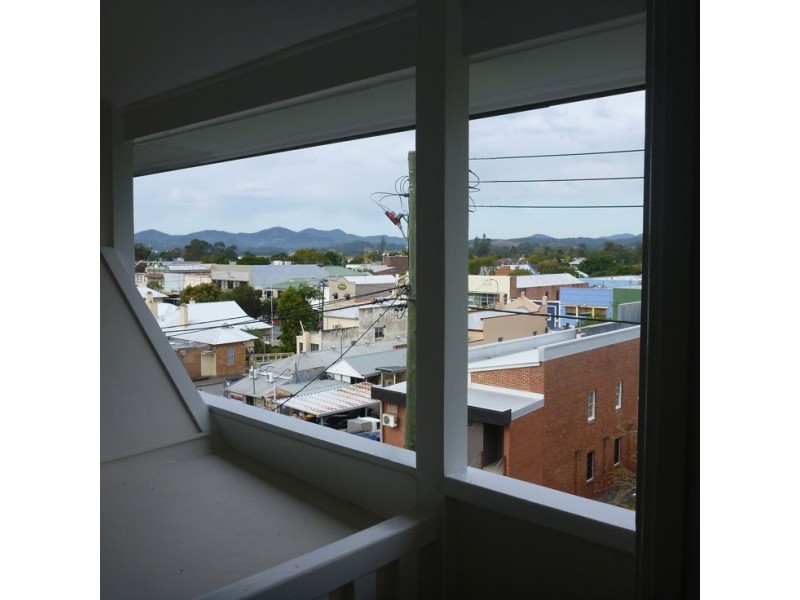
1/25 Church Lane, Murwillumbah NSW 2484 Light and Bright in the Centre of Town $310 Weekly 1 1 0 Listing ID: 5952607 Other properties to rent near 1/25 Church Lane, Murwillumbah NSW 2484 3/44 Brisbane Street, Murwillumbah NSW 2484 88 Murwillumbah Street, Murwillumbah NSW 2484 Unit 2/5 Nullum Street, Murwillumbah NSW 2484 3 3 Church Lane, Murwillumbah NSW 2484 U6 3 Church Lane,, Murwillumbah NSW 2484 Location THIS PROPERTY WAS LEASED Enquiry about this property Name* Email* Phone* Message* Send me regular newsletters from Homehound Have agents get in touch about similar properties within the area What is 8 + 20?* Receive email alerts for properties like this Email alerts Email* Send me regular newsletters from Homehound. Have agents get in touch about similar properties within the area What is 8 + 20?*