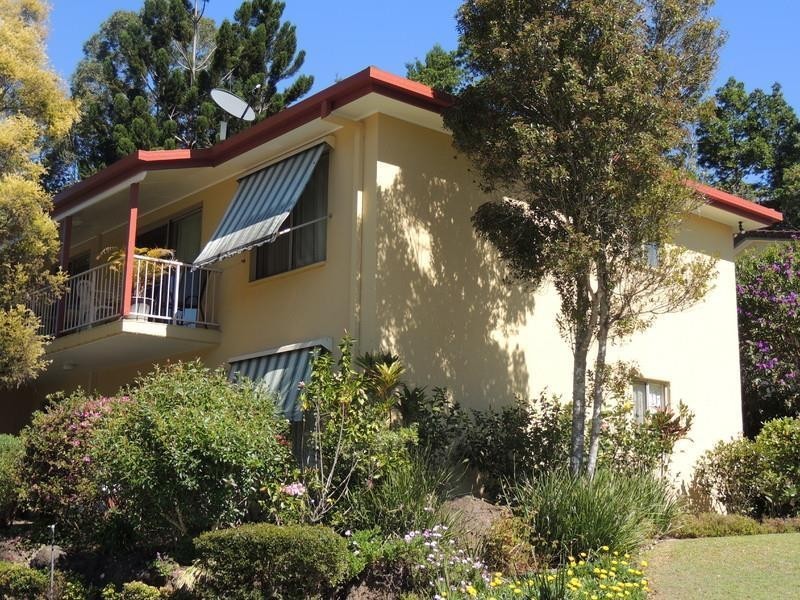
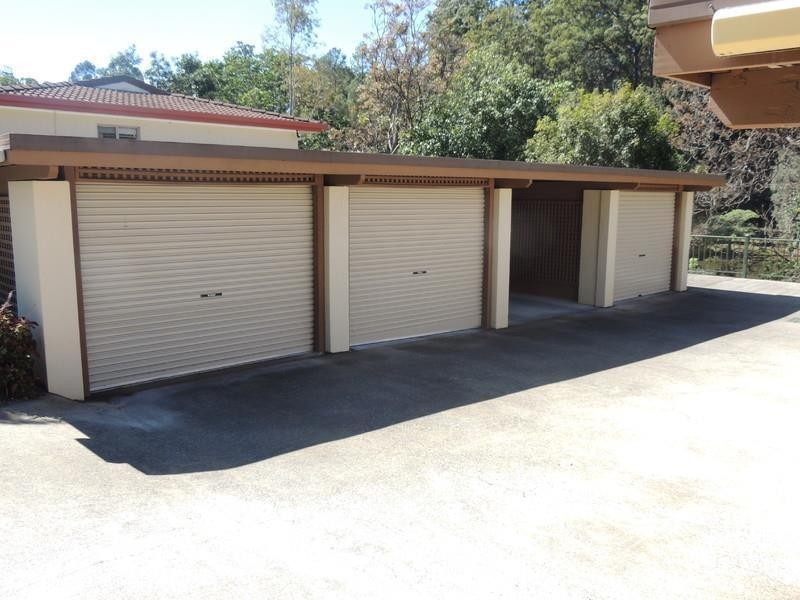
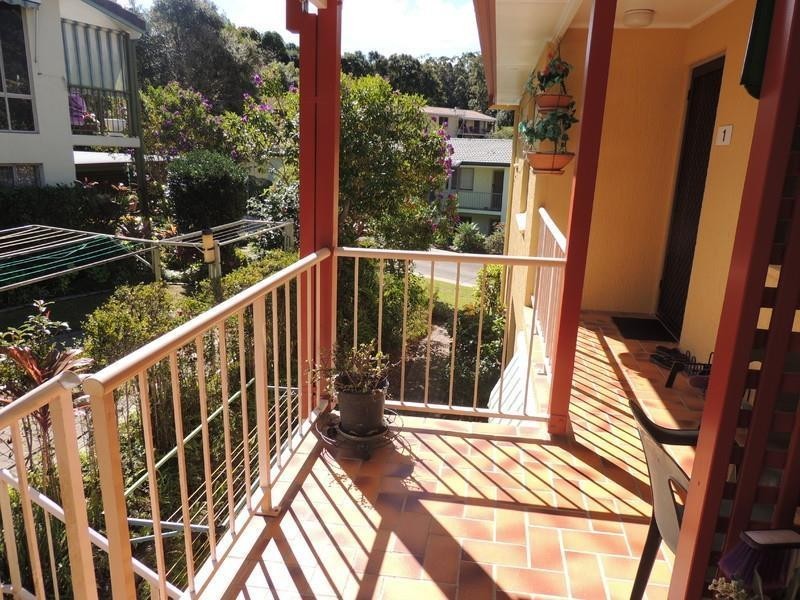
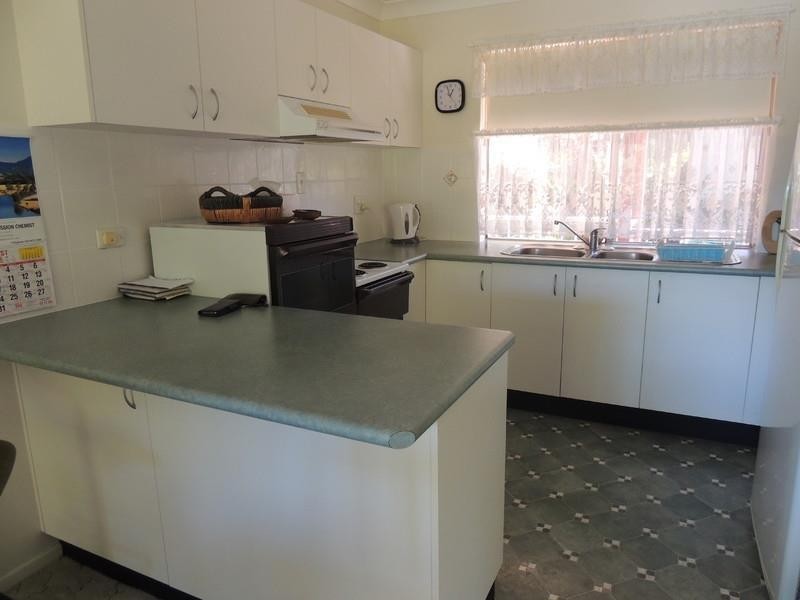
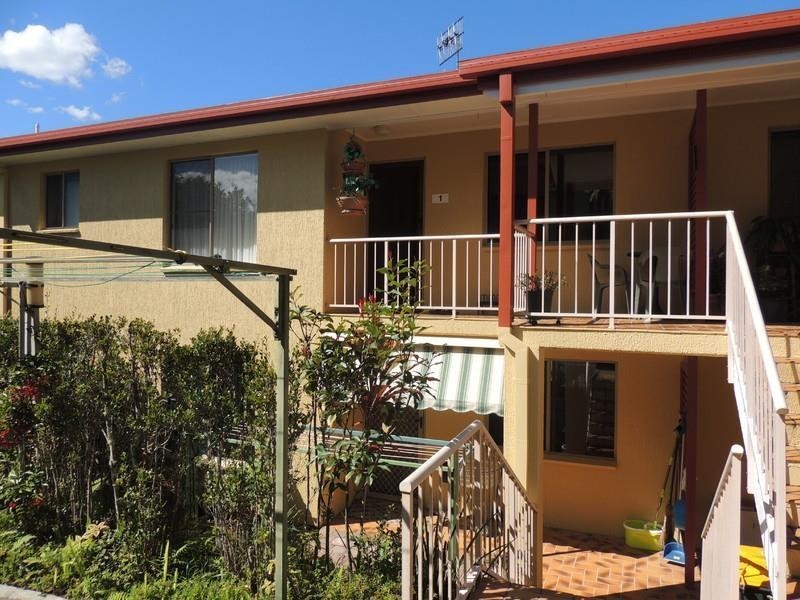
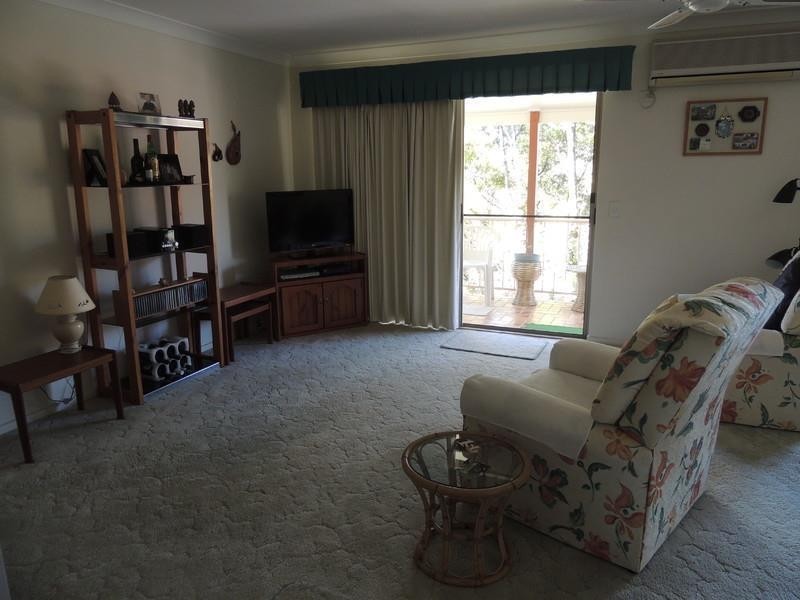
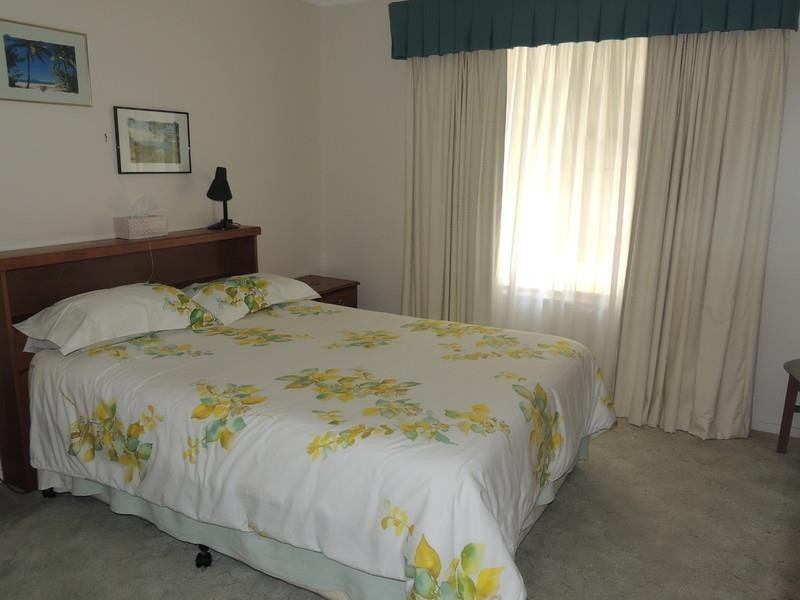
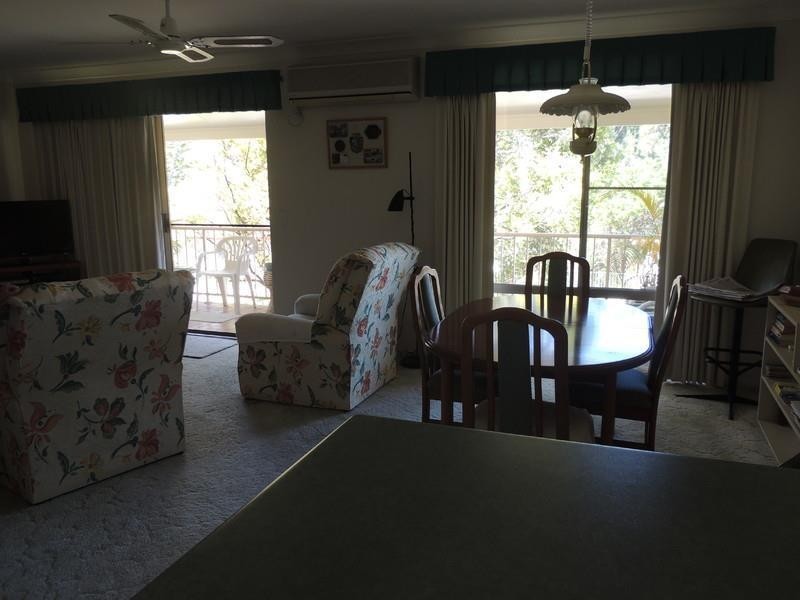
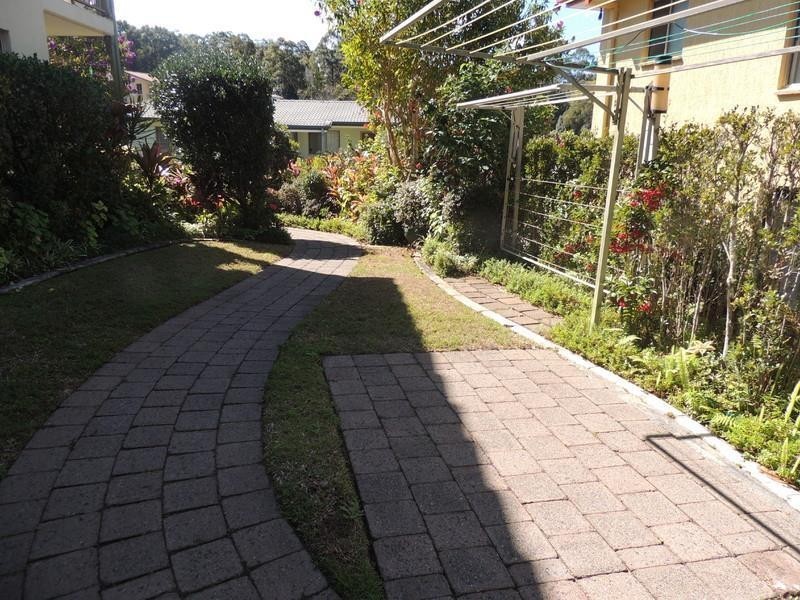
1 Fern Avenue, Murwillumbah NSW 2484 Comfortable Retirement Living $145,000 Listing history: 18 Oct, 2016 2 1 2 Listing ID: 32587713 Other properties for sale near 1 Fern Avenue, Murwillumbah NSW 2484 33 Fern Avenue, Murwillumbah NSW 2484 2 Fern Ave,, Murwillumbah NSW 2484 Location THIS PROPERTY WAS WITHDRAWN Enquiry about this property Name* Email* Phone* Message* Send me regular newsletters from Homehound Have agents get in touch about similar properties within the area What is 8 + 20?* Receive email alerts for properties like this Email alerts Email* Send me regular newsletters from Homehound. Have agents get in touch about similar properties within the area What is 8 + 20?*