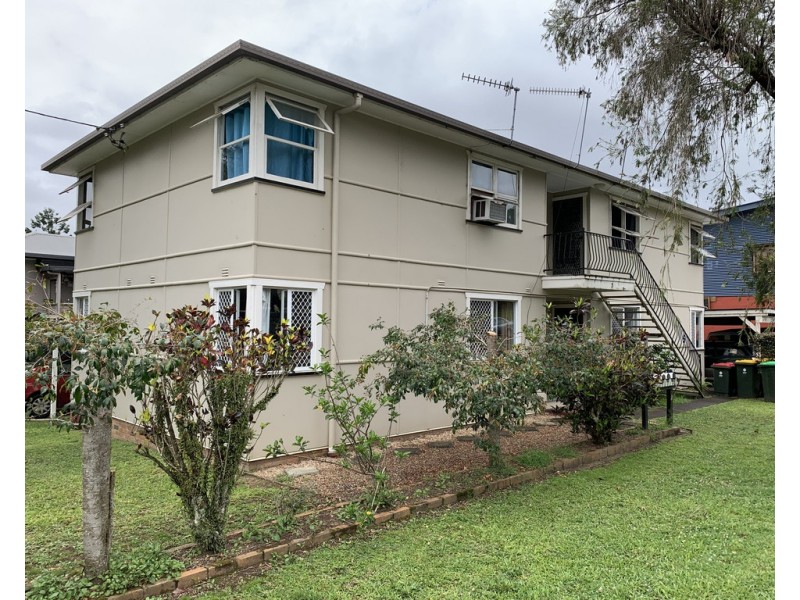
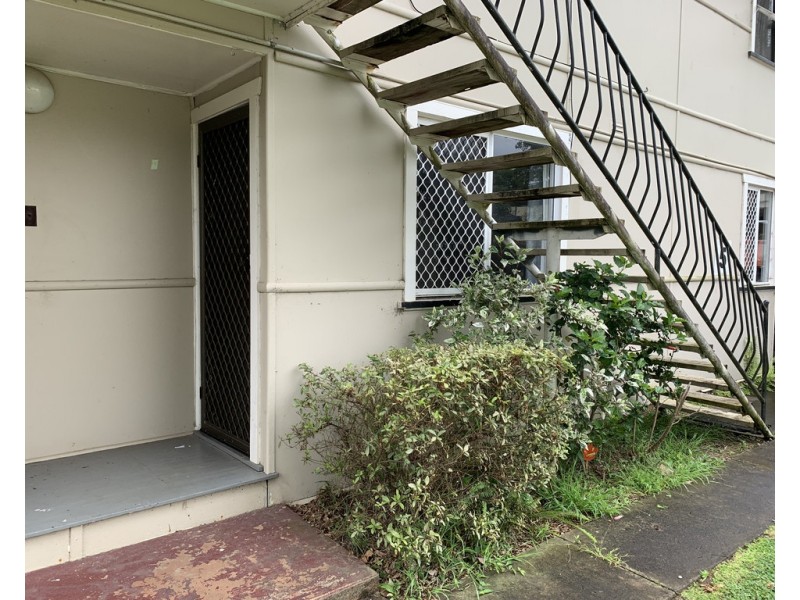
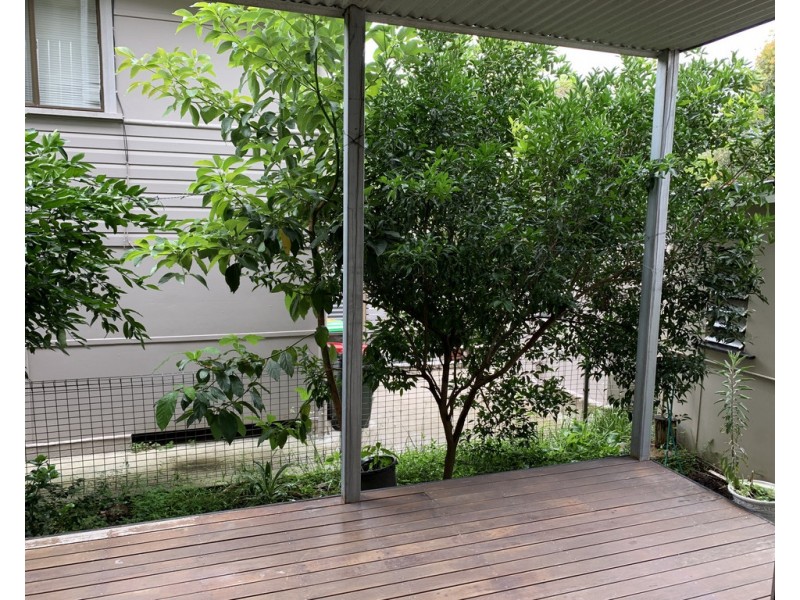
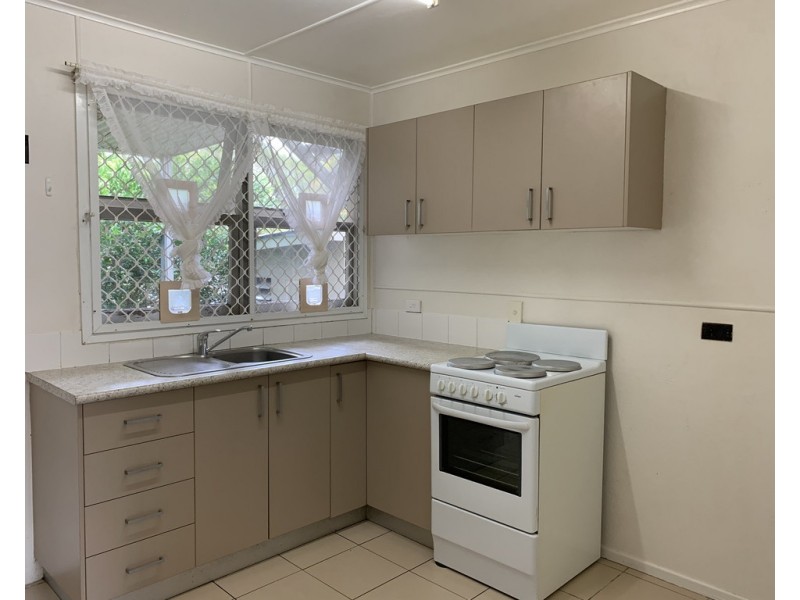
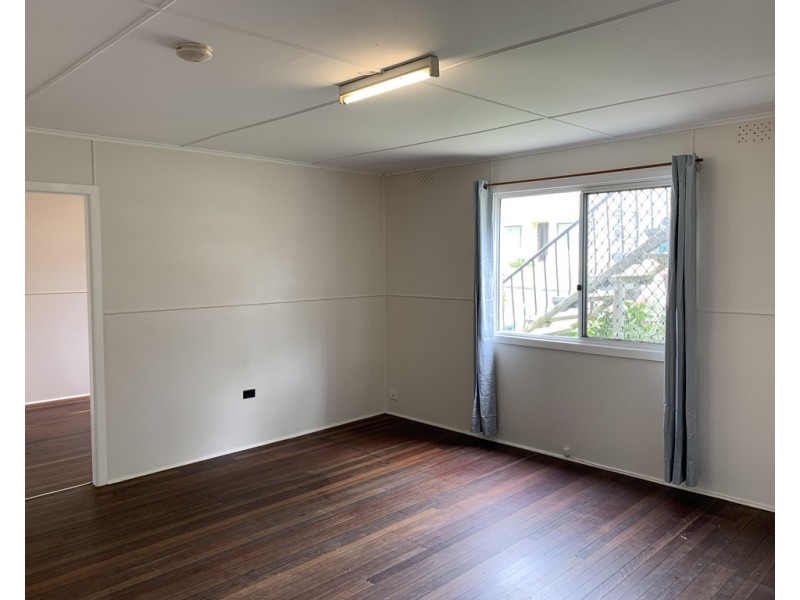
There are approximately 18,049 people living in Murwillumbah but… who are they?
44
49%
51%
Suburb Stats
$834/WK
$250/WK
$382/WK
Value of property in Murwillumbah and nearby suburbs
Murwillumbah
Binna Burra
Chinderah
Nimbin
Average Home Price$479,070Average Rental Price$346Household Size2.5
Average Home Price$1,317,900Average Rental Price$547Household Size2.6
Average Home Price$458,464Average Rental Price$379Household Size2.3
Average Home Price$463,353Average Rental Price$314Household Size2.4
Water Useper year per person
0.6mln. litres
State Average 0.74 mln. litres
Nat. Average 0.74 mln. litres
Greenhouse Pollutionper year per person
16.48tonnes
State Average 19.31 tonnes
Nat. Average 20.3 tonnes
Dwelling Types
91%
5%
3%
Most Common Suburb Professions
17% Professio…
15% Technicia…
14% Managers…
12% Labourers…
Nearby schools: murwillumbah high school, mt st patrick college, murwillumbah community college, murwillumbah south infants school
Nearby cafes: fish bowl cafe, the modern grocer, sugar beat cafe, king street cafe
Nearby doctors: king street dental practice - dr. evans michael, king street medical centre- dr. j. stephenson, king street medical centre-jenkins helen, qml pathology
Nearby hospitals: murwillumbah district hospital, king street medical centre, queen street medical centre