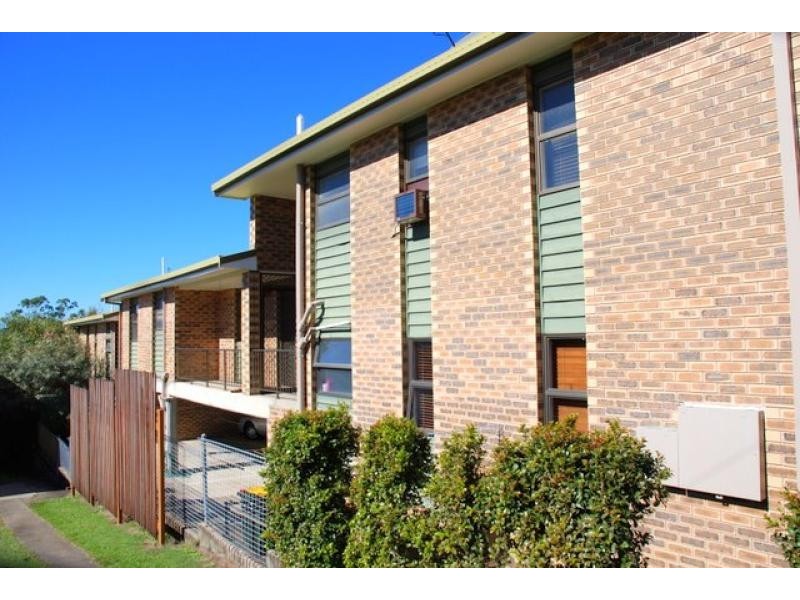
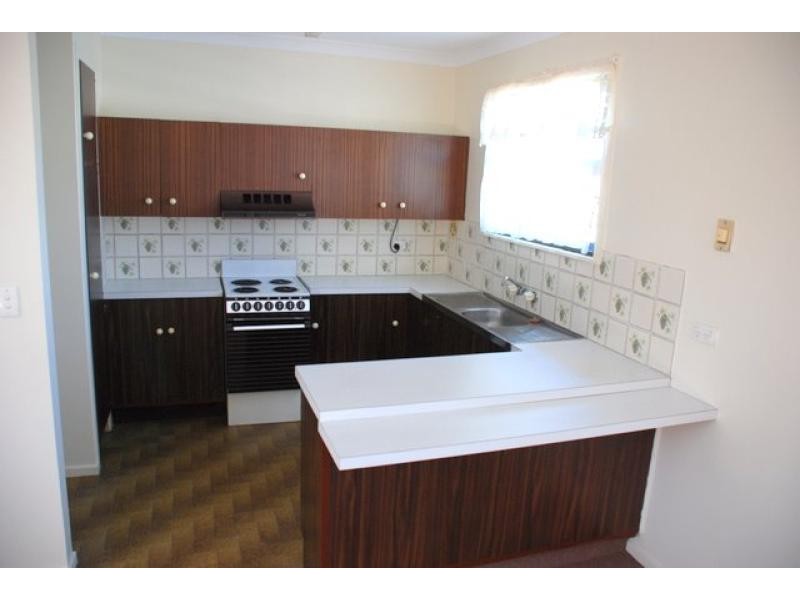
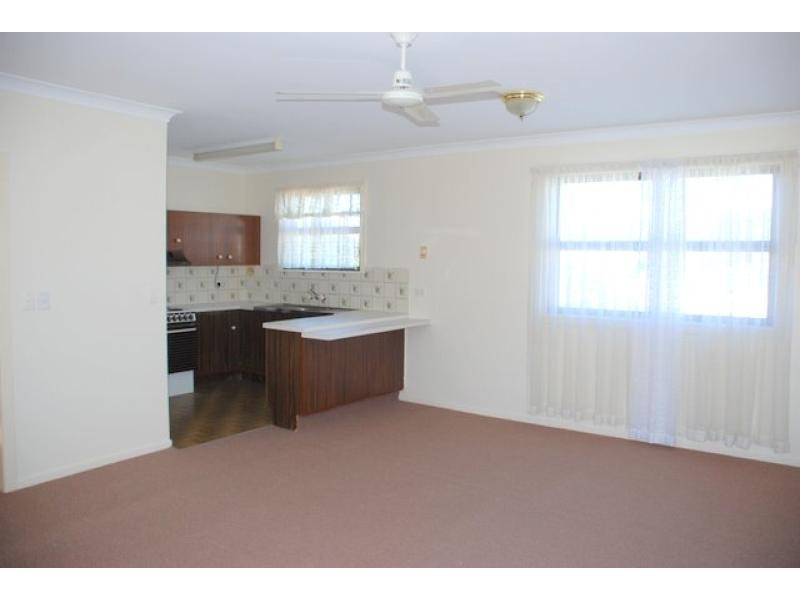
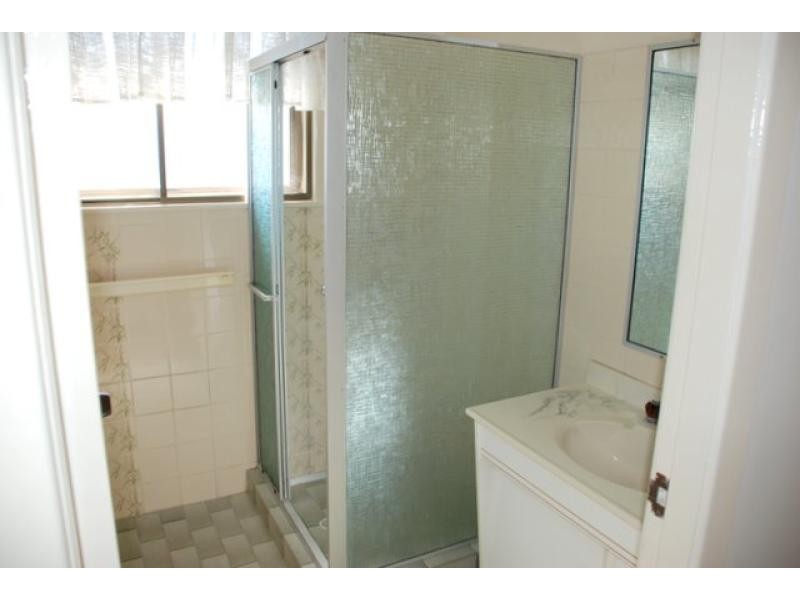
There are approximately 18,049 people living in Murwillumbah but… who are they?
44
49%
51%
Suburb Stats
$834/WK
$250/WK
$382/WK
Value of property in Murwillumbah and nearby suburbs
Murwillumbah
Burringbar
Ellangowan
Arrawarra Headland
Average Home Price$479,070Average Rental Price$346Household Size2.5
Average Home Price$722,921Average Rental Price$383Household Size2.4
Average Home Price$378,333Average Rental Price$273Household Size2.5
Average Home Price$709,769Average Rental Price$472Household Size2.5
Water Useper year per person
0.6mln. litres
State Average 0.74 mln. litres
Nat. Average 0.74 mln. litres
Greenhouse Pollutionper year per person
16.48tonnes
State Average 19.31 tonnes
Nat. Average 20.3 tonnes
Dwelling Types
91%
5%
3%
Most Common Suburb Professions
17% Professio…
15% Technicia…
14% Managers…
12% Labourers…
Nearby schools: murwillumbah east primary school, murwillumbah high school, murwillumbah community college, murwillumbah south infants school
Nearby cafes: cenzo cafe, the blue frog, sugar beat cafe, dabelles cafe
Nearby doctors: king street medical centre-jenkins helen, rightfoot podiatry & footwear clinics, king street medical centre- dr. j. stephenson, dr rafael maia
Nearby hospitals: king street medical centre, murwillumbah district hospital, queen street medical centre