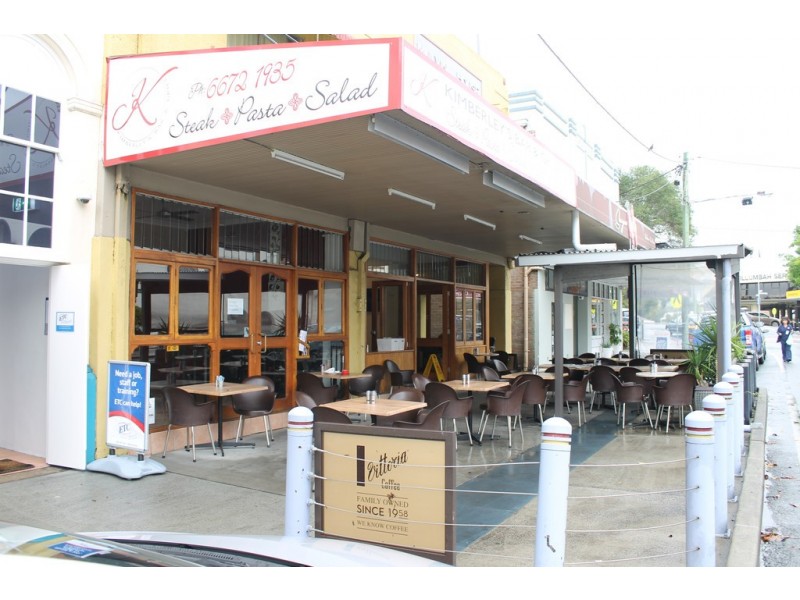
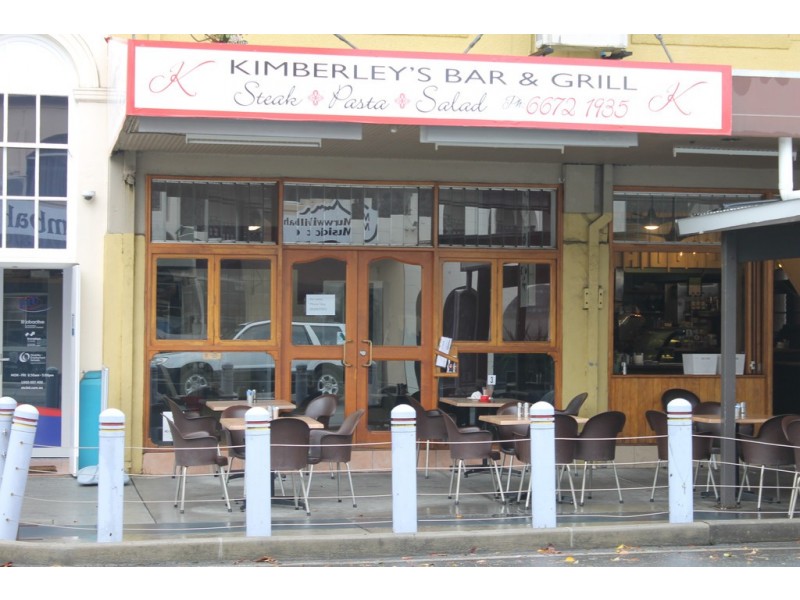
There are approximately 18,049 people living in Murwillumbah but… who are they?
44
49%
51%
Suburb Stats
$834/WK
$250/WK
$382/WK
Value of property in Murwillumbah and nearby suburbs
Murwillumbah
Binna Burra
Brushgrove
Arrawarra Headland
Average Home Price$479,070Average Rental Price$346Household Size2.5
Average Home Price$1,317,900Average Rental Price$547Household Size2.6
Average Home Price$460,239Average Rental Price$327Household Size2.4
Average Home Price$709,769Average Rental Price$472Household Size2.5
Water Useper year per person
0.6mln. litres
State Average 0.74 mln. litres
Nat. Average 0.74 mln. litres
Greenhouse Pollutionper year per person
16.48tonnes
State Average 19.31 tonnes
Nat. Average 20.3 tonnes
Dwelling Types
91%
5%
3%
Most Common Suburb Professions
17% Professio…
15% Technicia…
14% Managers…
12% Labourers…
Nearby schools: murwillumbah community college, murwillumbah east primary school, mt st patrick college, murwillumbah south infants school
Nearby cafes: the modern grocer, the blue frog, dabelles cafe, sugar beat cafe
Nearby doctors: king street medical centre-dr yabsley robyn, king street medical centre-dr alan secombe, king street dental practice - dr. evans michael, king street medical centre- dr. j. stephenson
Nearby hospitals: king street medical centre, murwillumbah district hospital, queen street medical centre