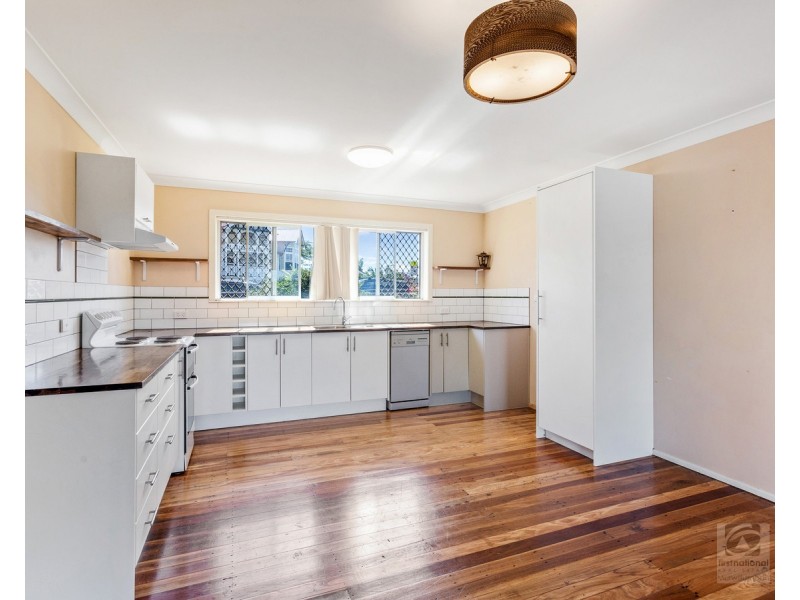
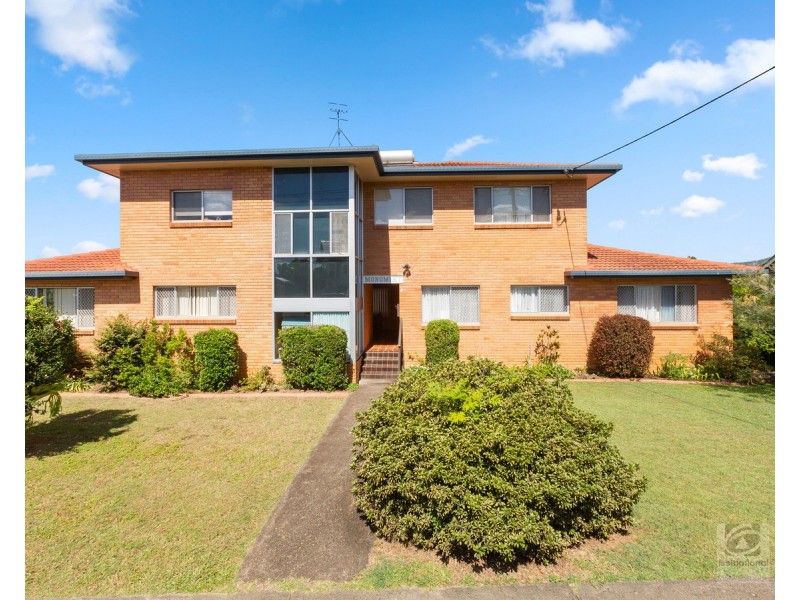
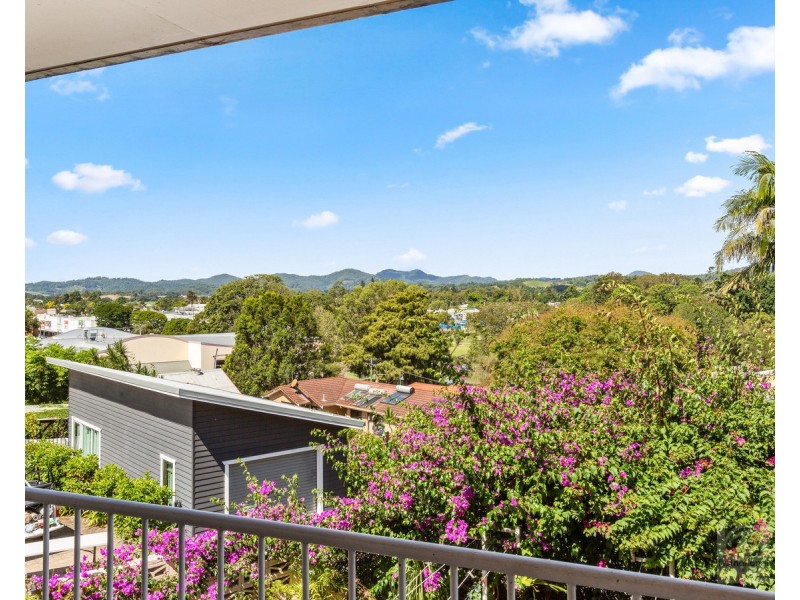
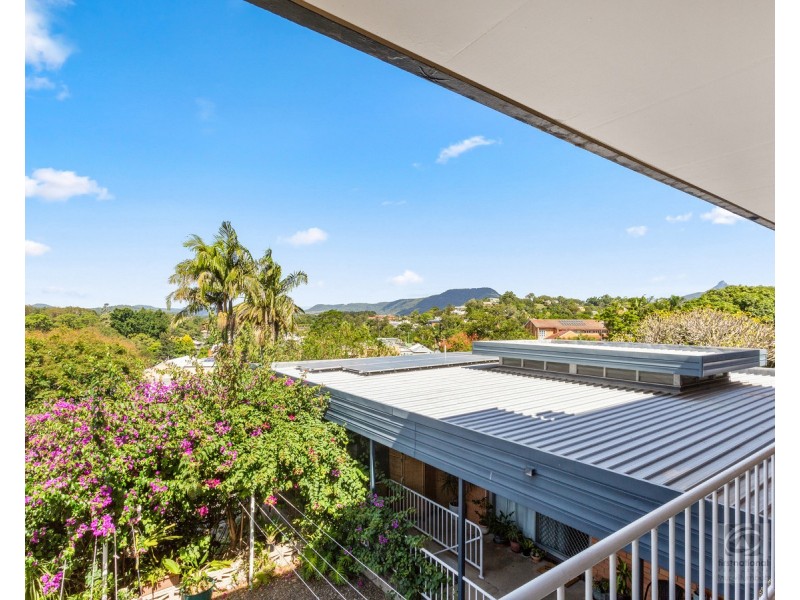
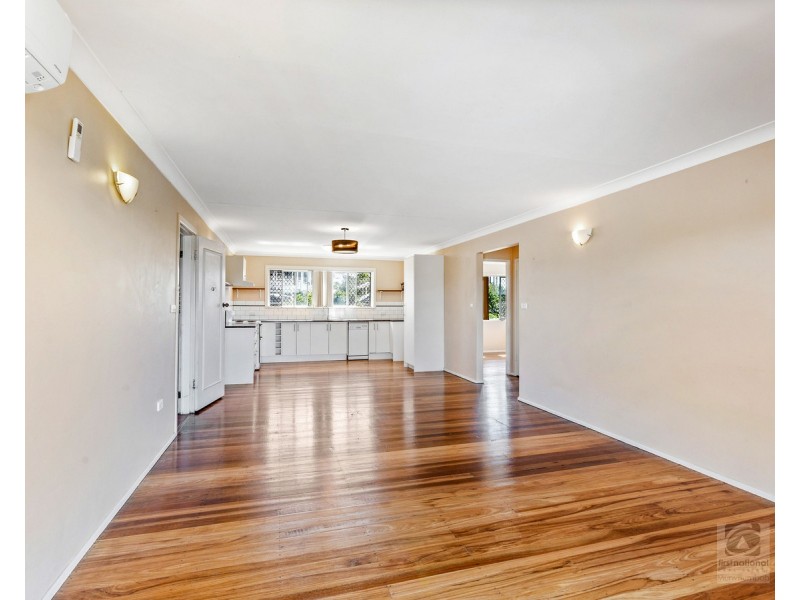
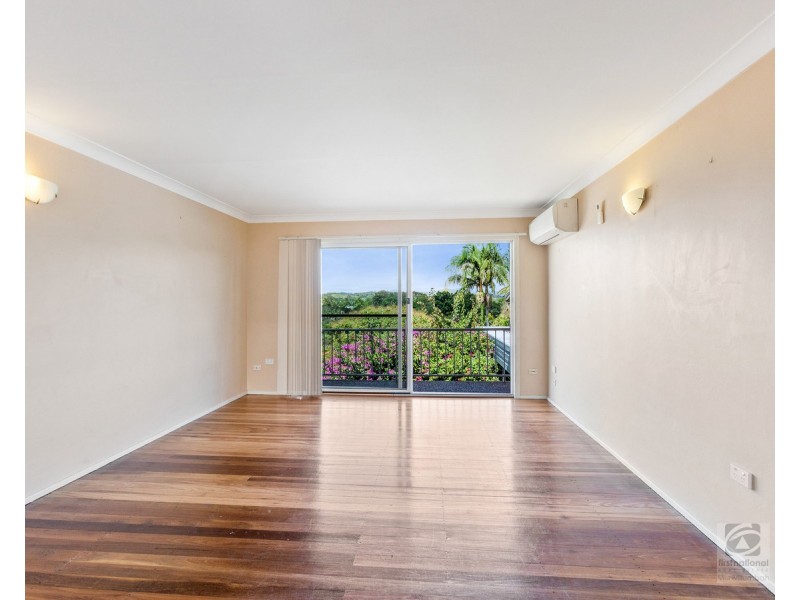
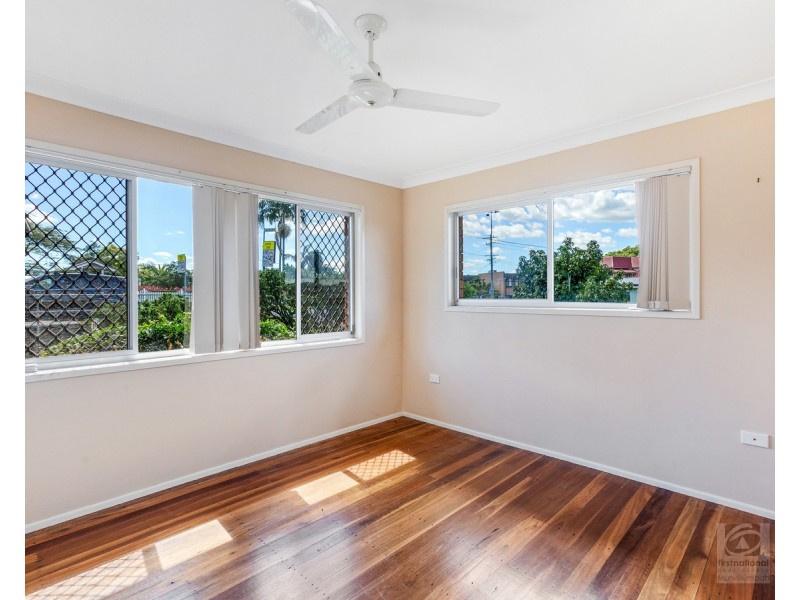
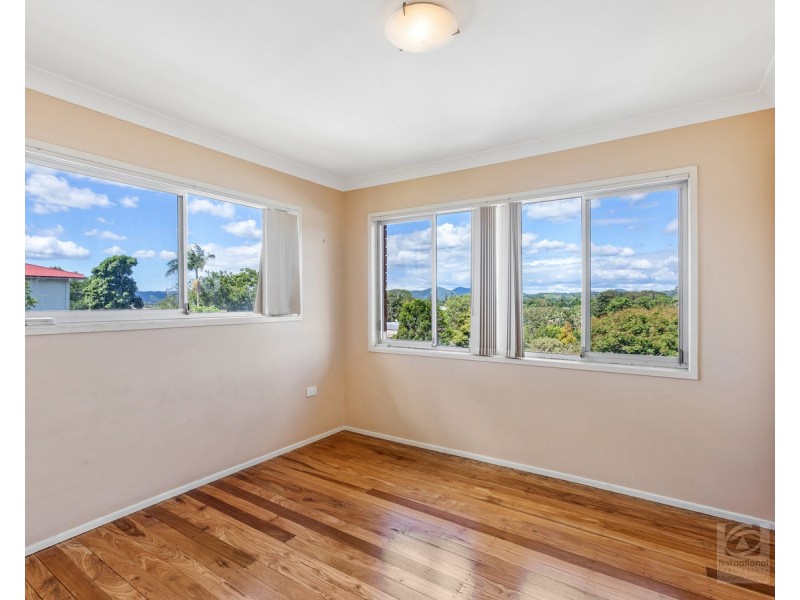
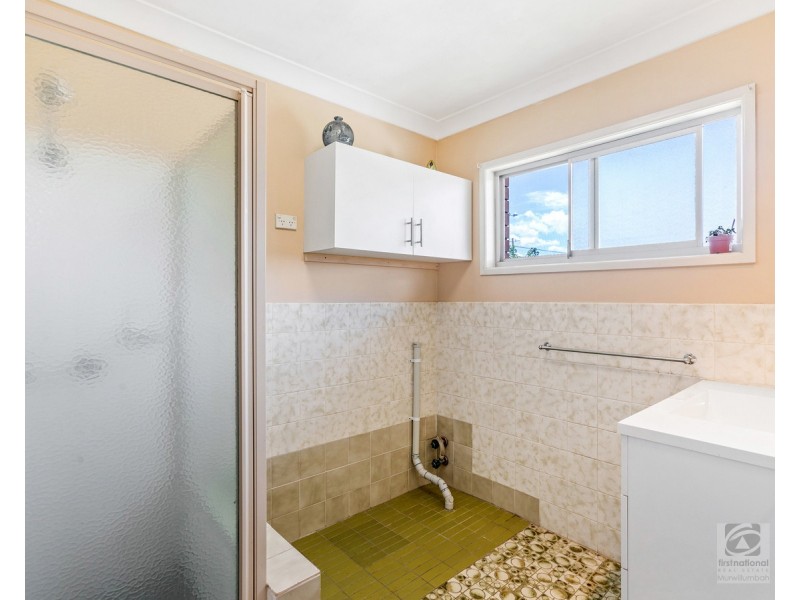
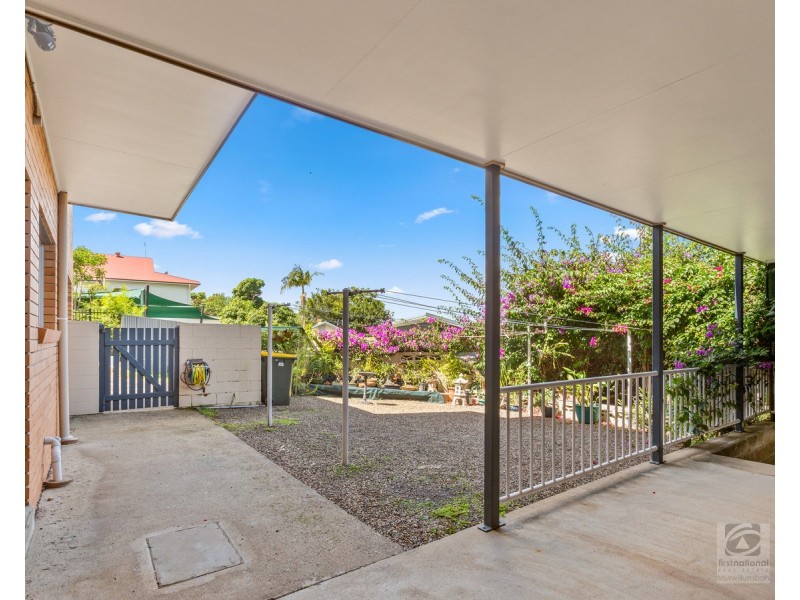
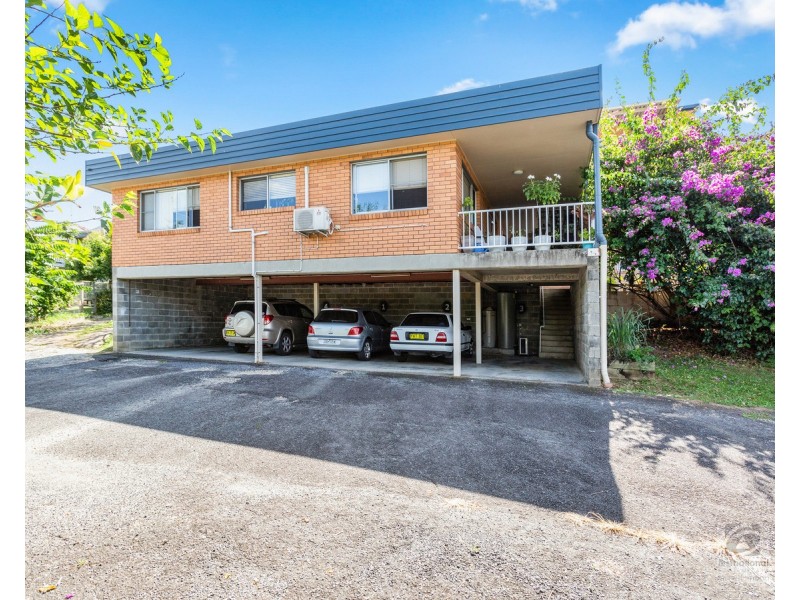
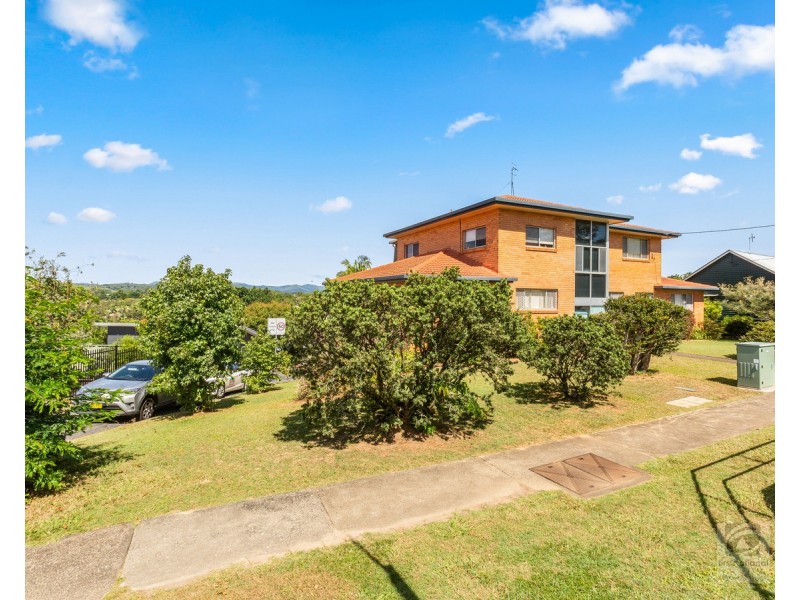
There are approximately 18,049 people living in Murwillumbah but… who are they?
44
49%
51%
Suburb Stats
$834/WK
$250/WK
$382/WK
Value of property in Murwillumbah and nearby suburbs
Murwillumbah
Wollongbar
Sandy Beach
Grafton
Average Home Price$479,070Average Rental Price$346Household Size2.5
Average Home Price$499,811Average Rental Price$342Household Size2.4
Average Home Price$456,850Average Rental Price$354Household Size2.5
Average Home Price$314,959Average Rental Price$305Household Size2.4
Water Useper year per person
0.6mln. litres
State Average 0.74 mln. litres
Nat. Average 0.74 mln. litres
Greenhouse Pollutionper year per person
16.48tonnes
State Average 19.31 tonnes
Nat. Average 20.3 tonnes
Dwelling Types
91%
5%
3%
Most Common Suburb Professions
17% Professio…
15% Technicia…
14% Managers…
12% Labourers…
Nearby schools: murwillumbah south infants school, murwillumbah community college, murwillumbah east primary school, murwillumbah high school
Nearby cafes: the blue frog, fish bowl cafe, sugar beat cafe, the modern grocer
Nearby doctors: rightfoot podiatry & footwear clinics, king street dental practice - dr. evans michael, main street medical centre, queen street medical centre
Nearby hospitals: king street medical centre, murwillumbah district hospital, queen street medical centre