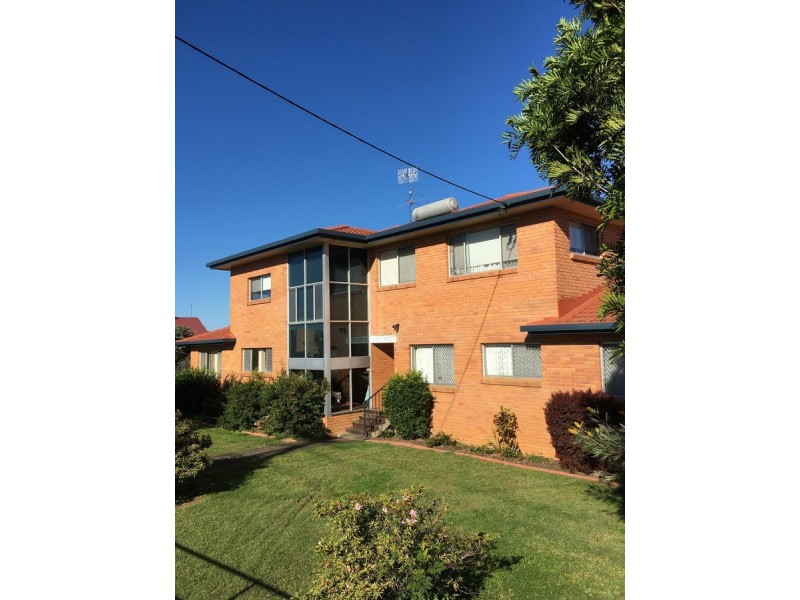
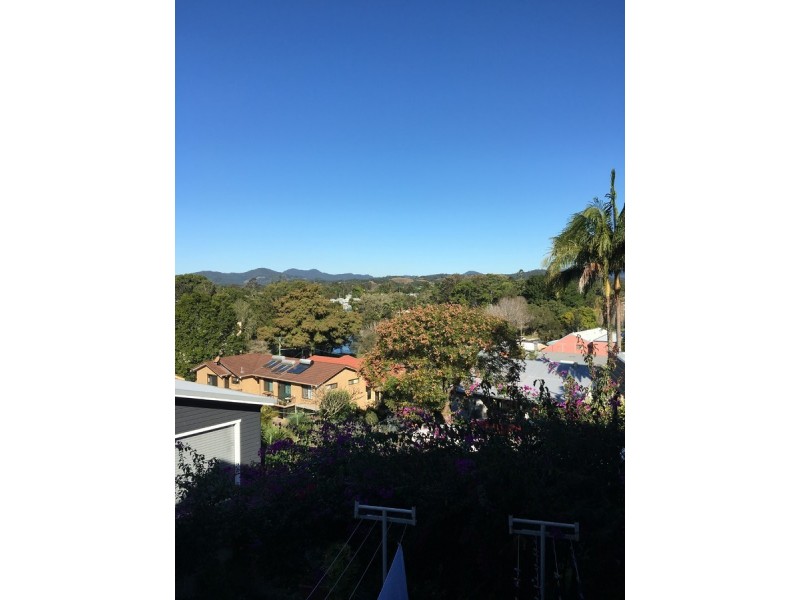
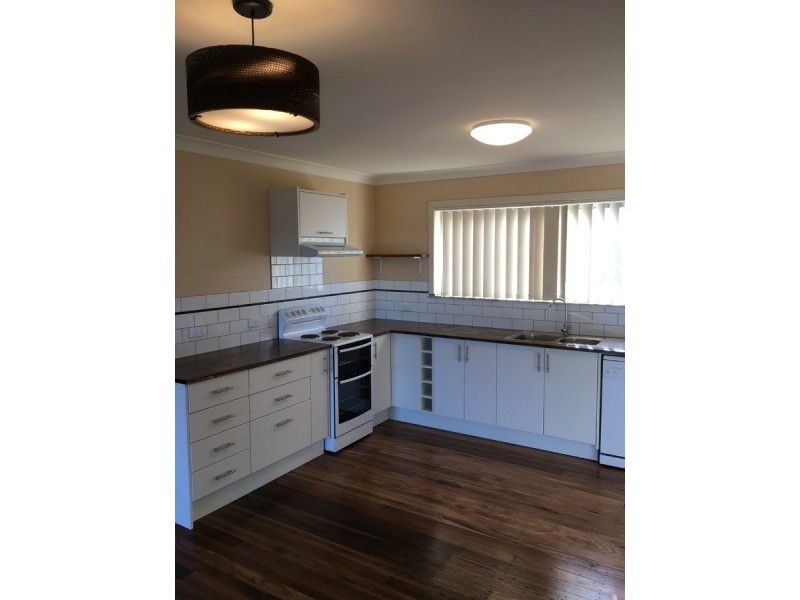
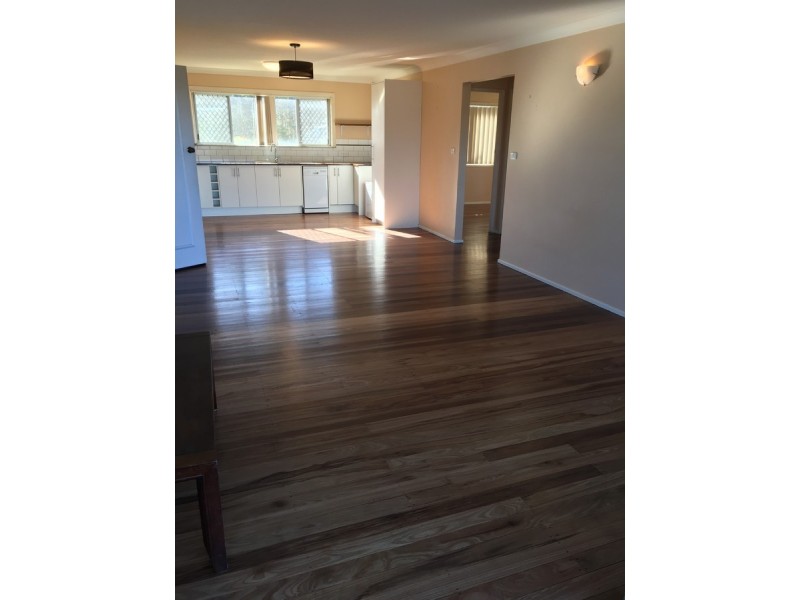
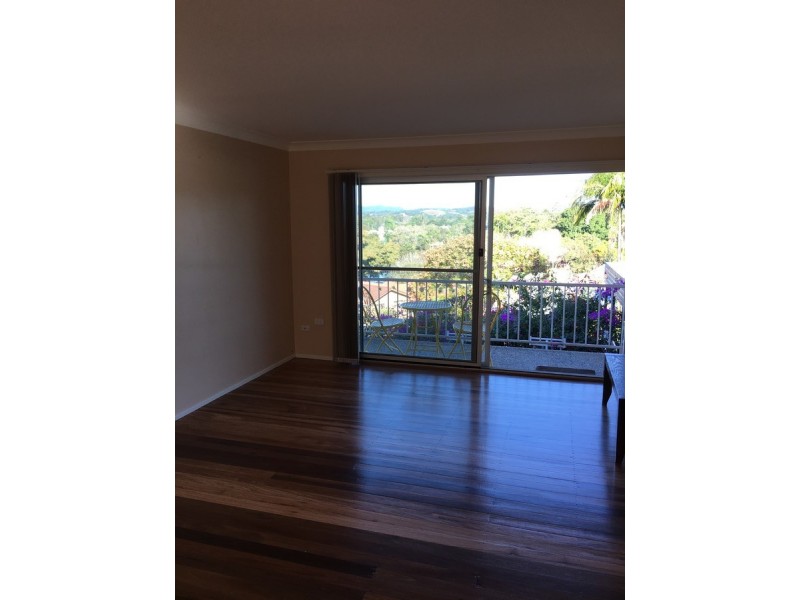
3/8 Byangum Road, Murwillumbah NSW 2484 CONVENIENT AND COMFORTABLE $350 per week Listing history: 29 Oct, 2009 2 1 1 Listing ID: 38529933 Other properties to rent near 3/8 Byangum Road, Murwillumbah NSW 2484 4/8 Byangum Road, Murwillumbah NSW 2484 Location THIS PROPERTY WAS LEASED Enquiry about this property Name* Email* Phone* Message* Send me regular newsletters from Homehound Have agents get in touch about similar properties within the area What is 8 + 20?* Receive email alerts for properties like this Email alerts Email* Send me regular newsletters from Homehound. Have agents get in touch about similar properties within the area What is 8 + 20?*