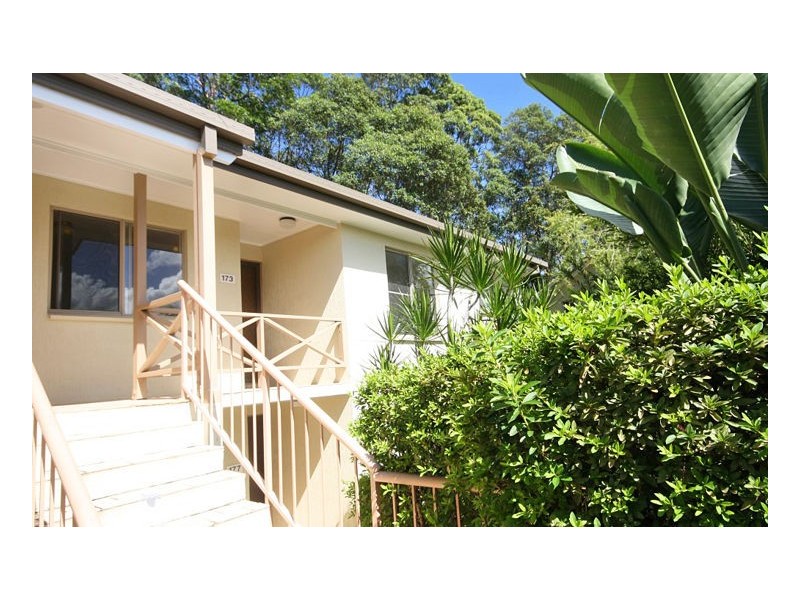
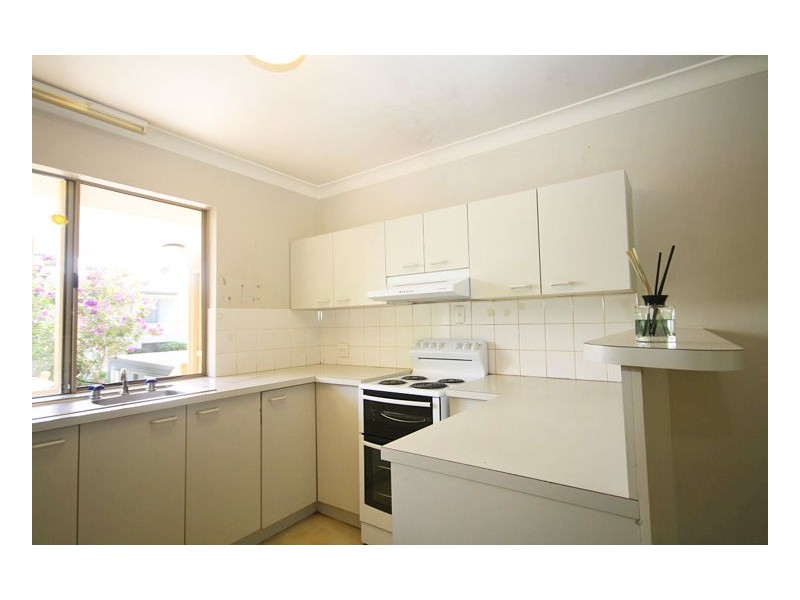
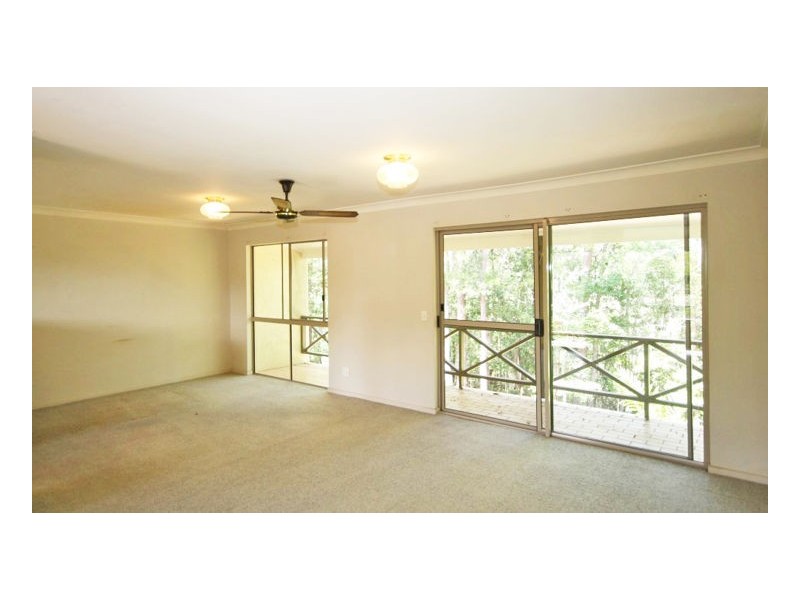
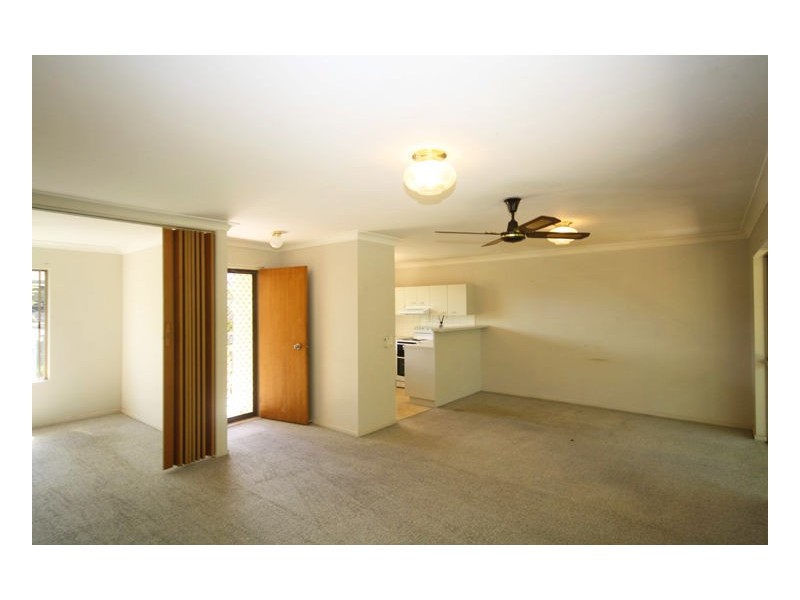
There are approximately 18,049 people living in Murwillumbah but… who are they?
44
49%
51%
Suburb Stats
$834/WK
$250/WK
$382/WK
Value of property in Murwillumbah and nearby suburbs
Murwillumbah
Bangalow
Nimbin
Kingscliff
Average Home Price$478,633Average Rental Price$346Household Size2.5
Average Home Price$906,546Average Rental Price$601Household Size2.6
Average Home Price$463,353Average Rental Price$314Household Size2.4
Average Home Price$714,128Average Rental Price$484Household Size2.3
Water Useper year per person
0.6mln. litres
State Average 0.74 mln. litres
Nat. Average 0.74 mln. litres
Greenhouse Pollutionper year per person
16.48tonnes
State Average 19.31 tonnes
Nat. Average 20.3 tonnes
Dwelling Types
91%
5%
3%
Most Common Suburb Professions
17% Professio…
15% Technicia…
14% Managers…
12% Labourers…
Nearby schools: murwillumbah community college, murwillumbah high school, murwillumbah south infants school, mt st patrick college
Nearby cafes: the blue frog, the modern grocer, fish bowl cafe, auto cafe
Nearby doctors: king street medical centre-dr yabsley robyn, king street dental practice - dr. evans michael, advanced radiology clinics murwillumbah, snedden d a
Nearby hospitals: murwillumbah district hospital, queen street medical centre, king street medical centre