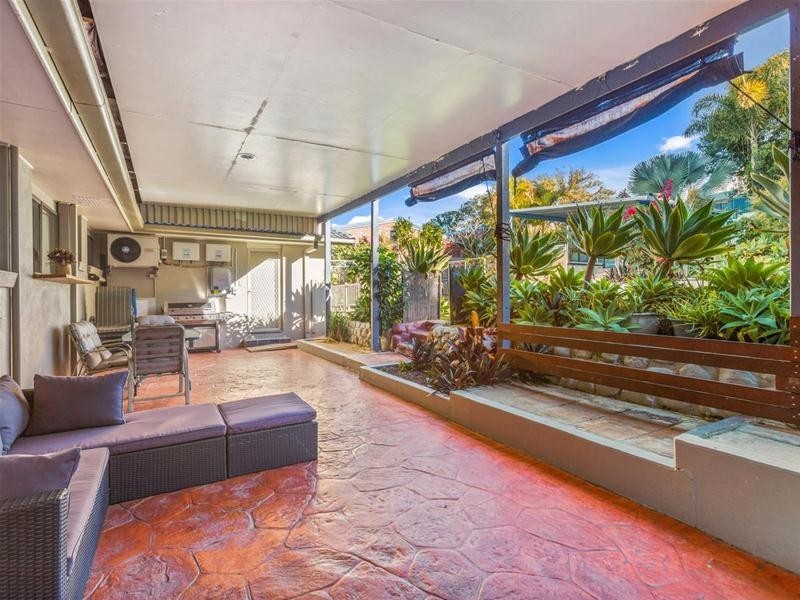
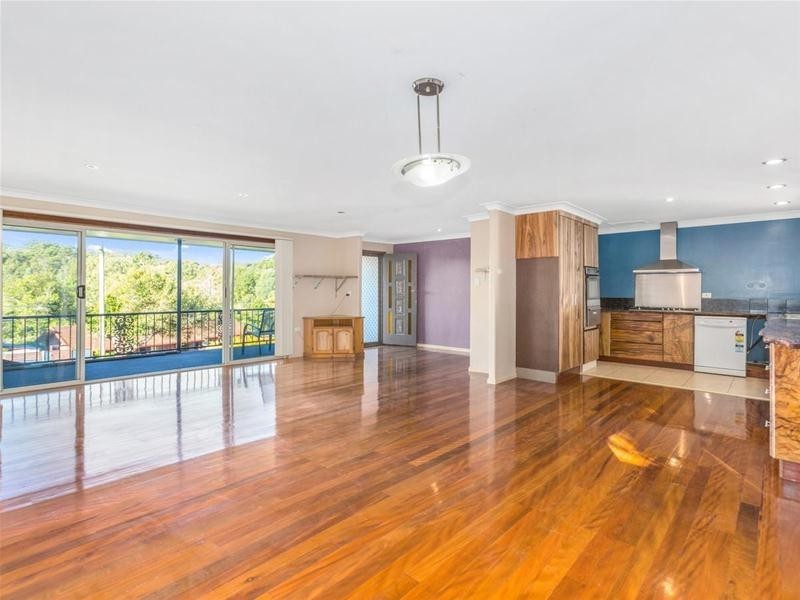
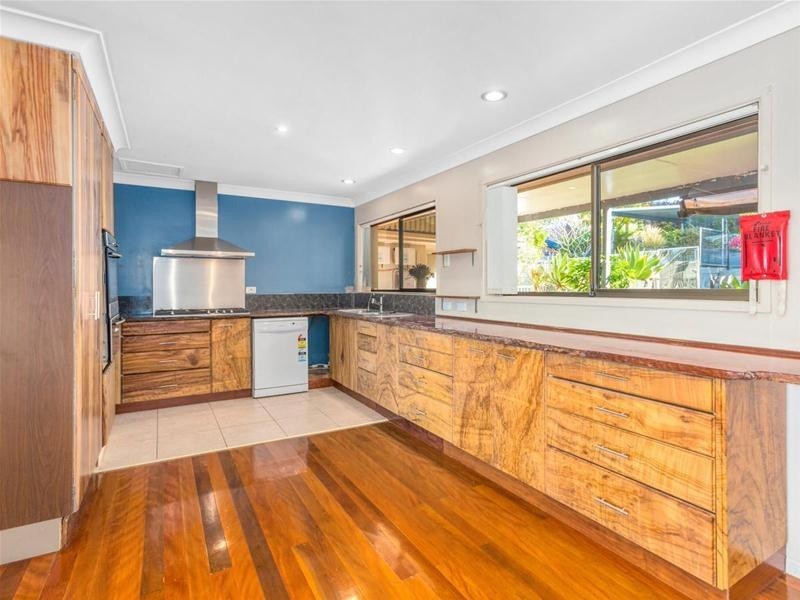
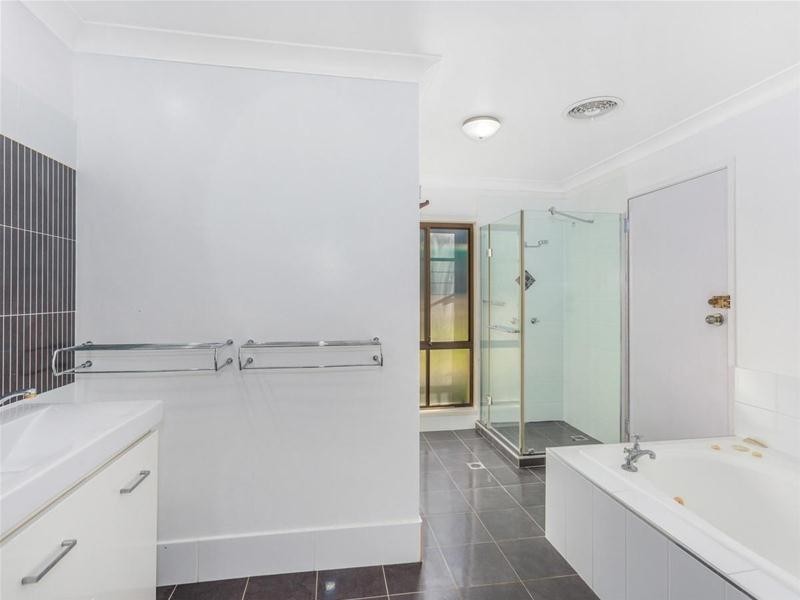
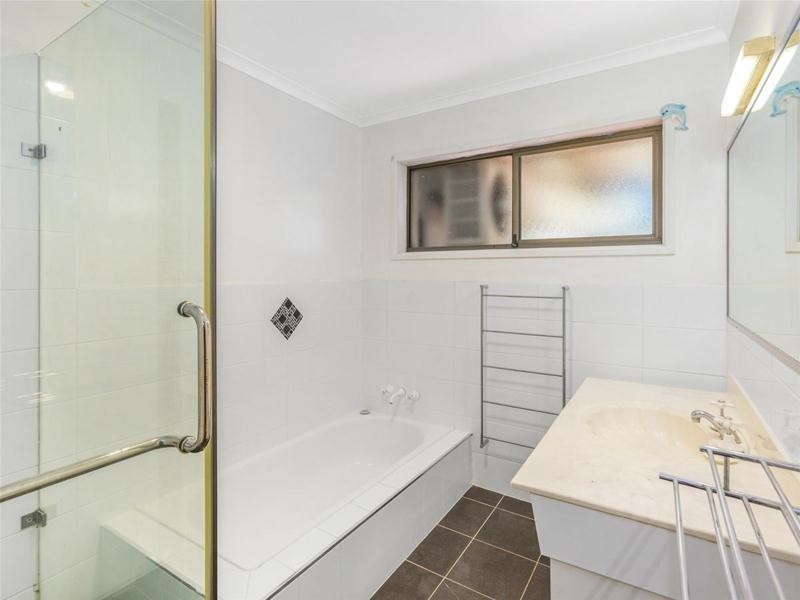
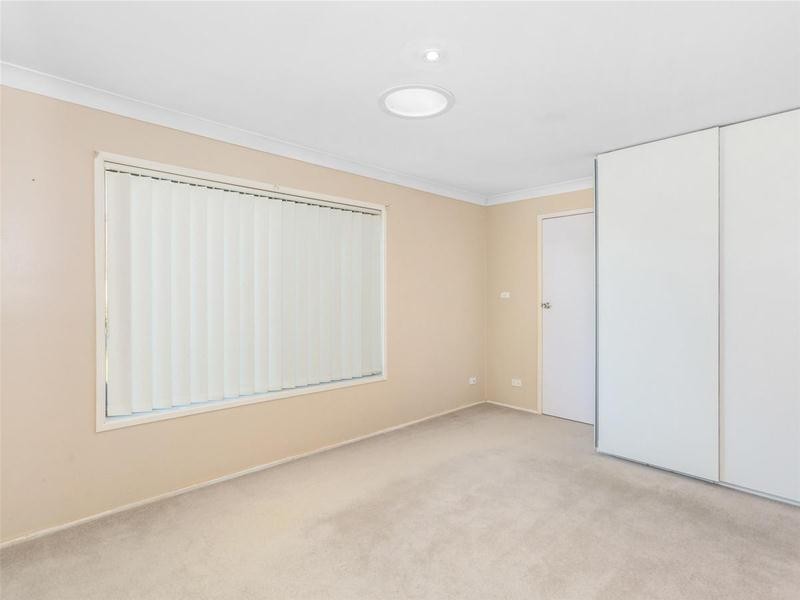
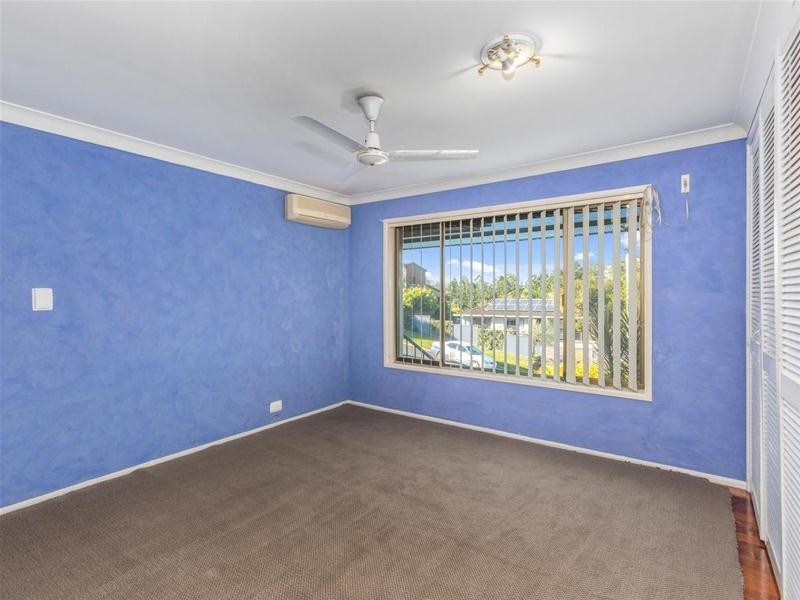
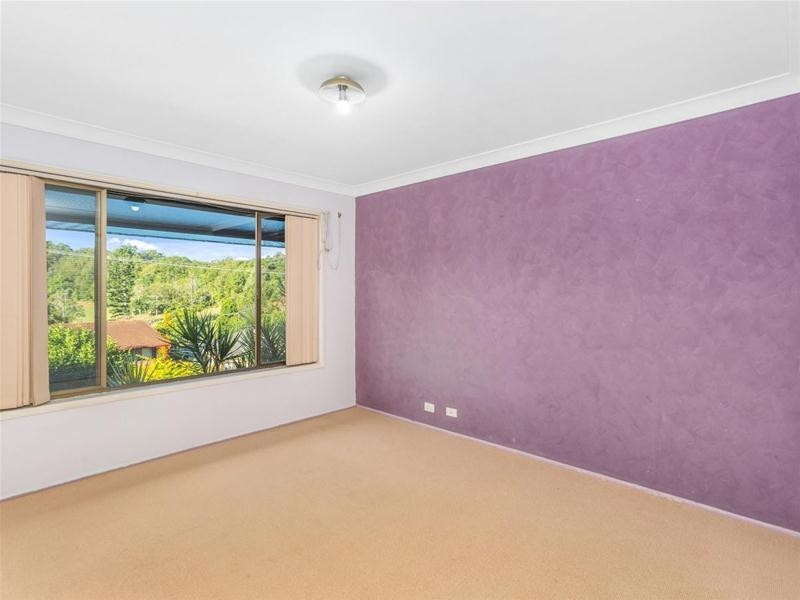
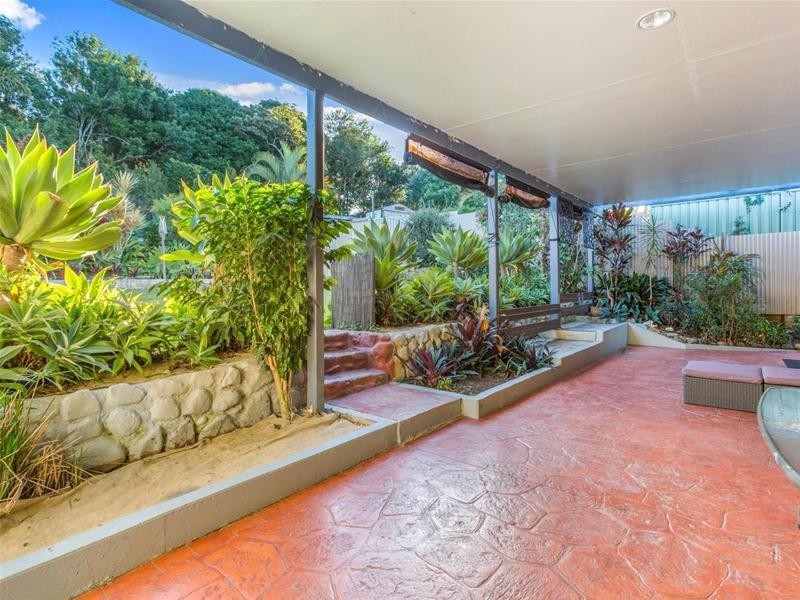
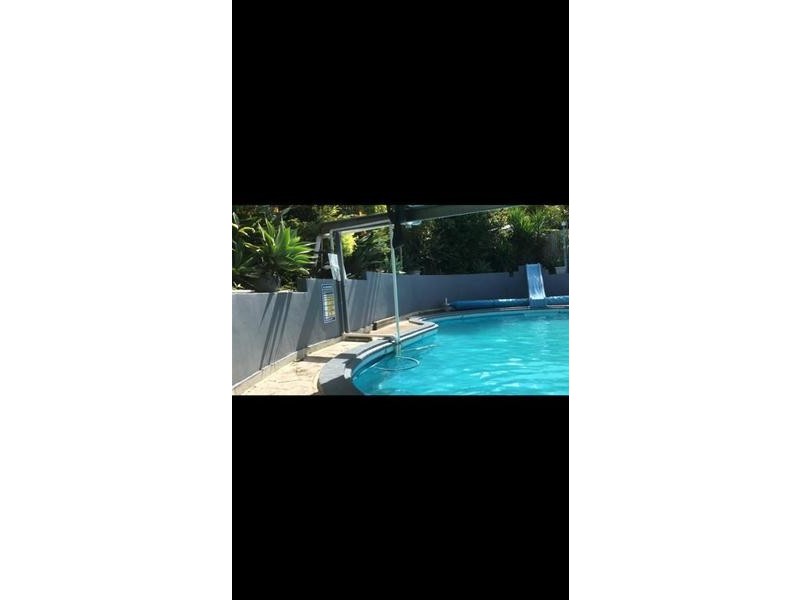
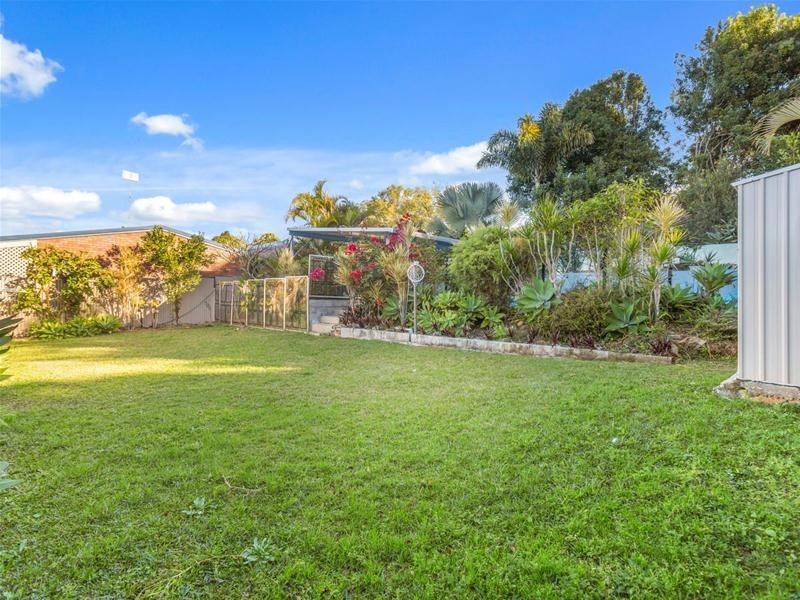
There are approximately 18,049 people living in Murwillumbah but… who are they?
44
49%
51%
Suburb Stats
$834/WK
$250/WK
$382/WK
Value of property in Murwillumbah and nearby suburbs
Murwillumbah
Burringbar
Clunes
South Grafton
Average Home Price$479,070Average Rental Price$346Household Size2.5
Average Home Price$722,921Average Rental Price$383Household Size2.4
Average Home Price$681,874Average Rental Price$475Household Size2.4
Average Home Price$271,720Average Rental Price$291Household Size2.4
Water Useper year per person
0.6mln. litres
State Average 0.74 mln. litres
Nat. Average 0.74 mln. litres
Greenhouse Pollutionper year per person
16.48tonnes
State Average 19.31 tonnes
Nat. Average 20.3 tonnes
Dwelling Types
91%
5%
3%
Most Common Suburb Professions
17% Professio…
15% Technicia…
14% Managers…
12% Labourers…
Nearby schools: murwillumbah east primary school, murwillumbah high school, murwillumbah community college, mt st patrick college
Nearby cafes: dabelles cafe, the blue frog, sugar beat cafe, auto cafe
Nearby doctors: king street dental practice - dr. evans michael, king street medical centre- dr. j. stephenson, king street dental practice, rightfoot podiatry & footwear clinics
Nearby hospitals: king street medical centre, murwillumbah district hospital, queen street medical centre