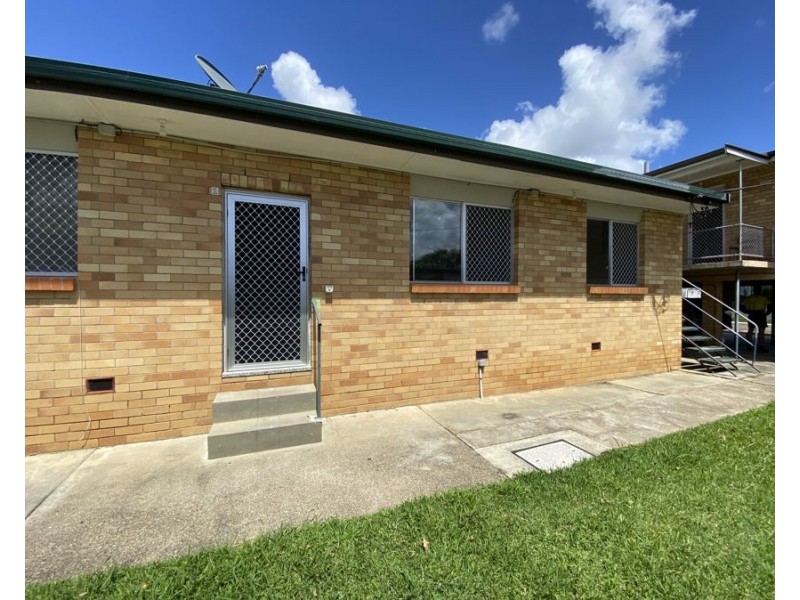
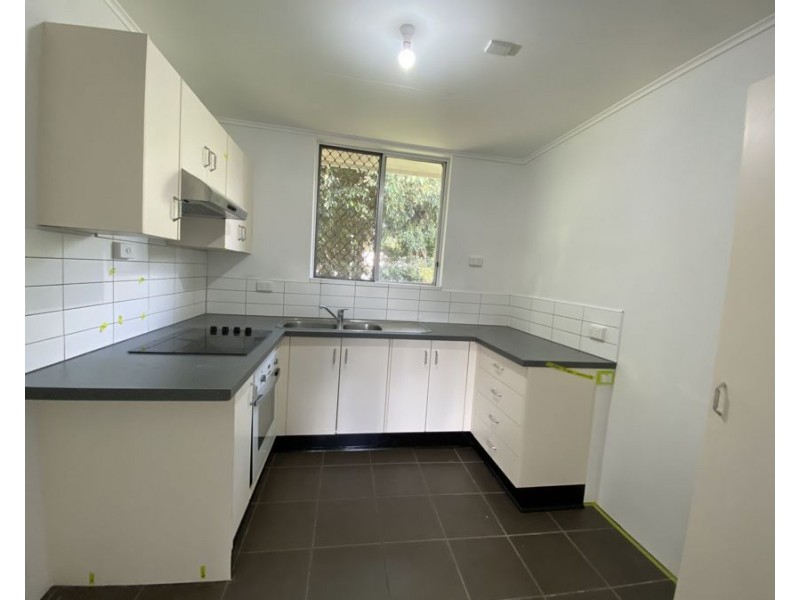
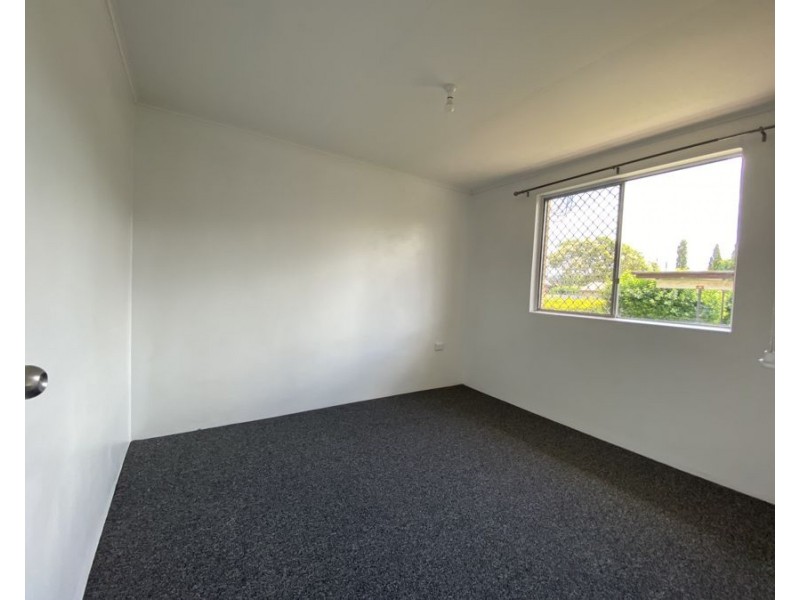
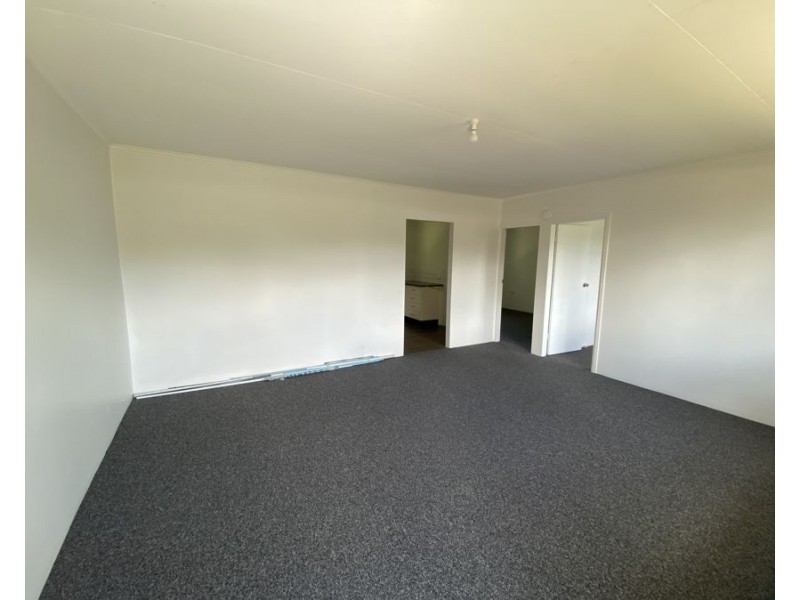
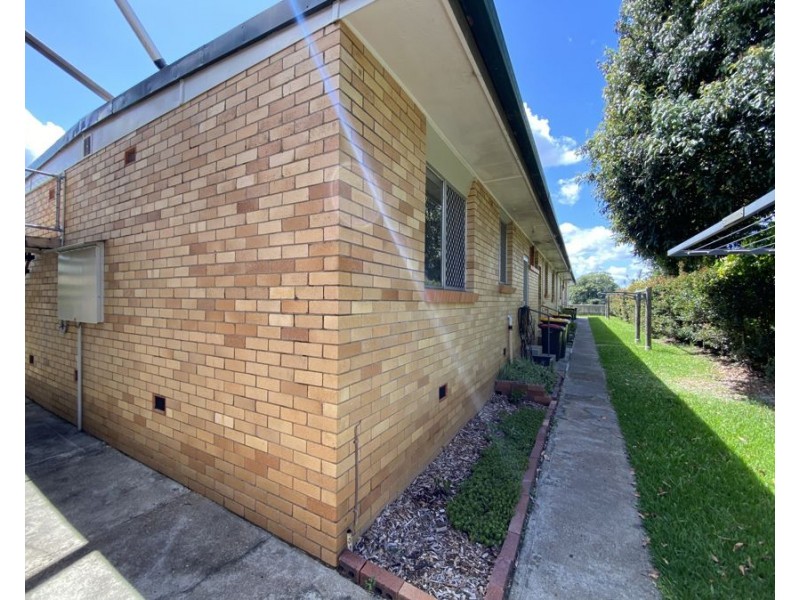
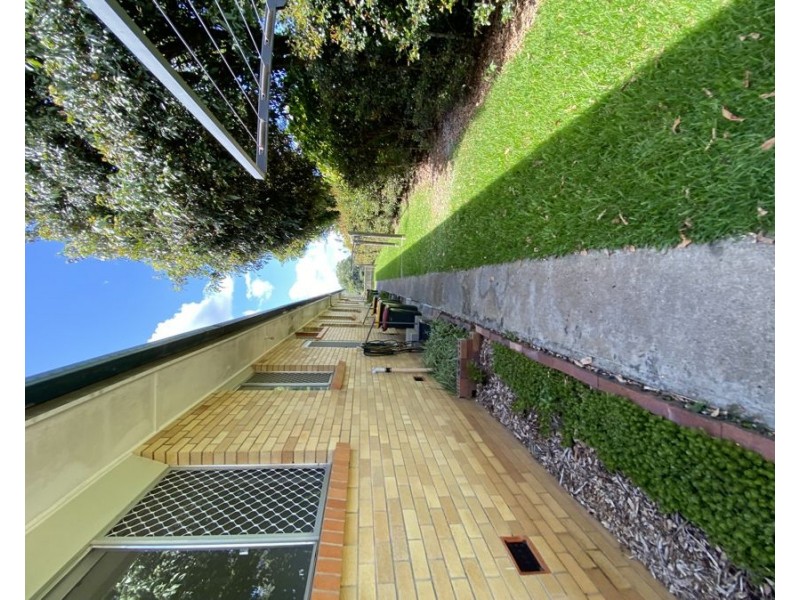
1/9 Tumbulgum Road, Murwillumbah NSW 2484 Conveniently Located $450 Weekly Listing history: 18 Jan, 2021 2 1 1 Enquire Listing ID: 31971628 Other properties to rent near 1/9 Tumbulgum Road, Murwillumbah NSW 2484 4/9 Tumbulgum Road, Murwillumbah NSW 2484 2/9 Tumbulgum Road, Murwillumbah NSW 2484 Location Enquire Enquiry about this property Name* Email* Phone* Message* Send me regular newsletters from Homehound Have agents get in touch about similar properties within the area What is 8 + 20?* Receive email alerts for properties like this Email alerts Email* Send me regular newsletters from Homehound. Have agents get in touch about similar properties within the area What is 8 + 20?*