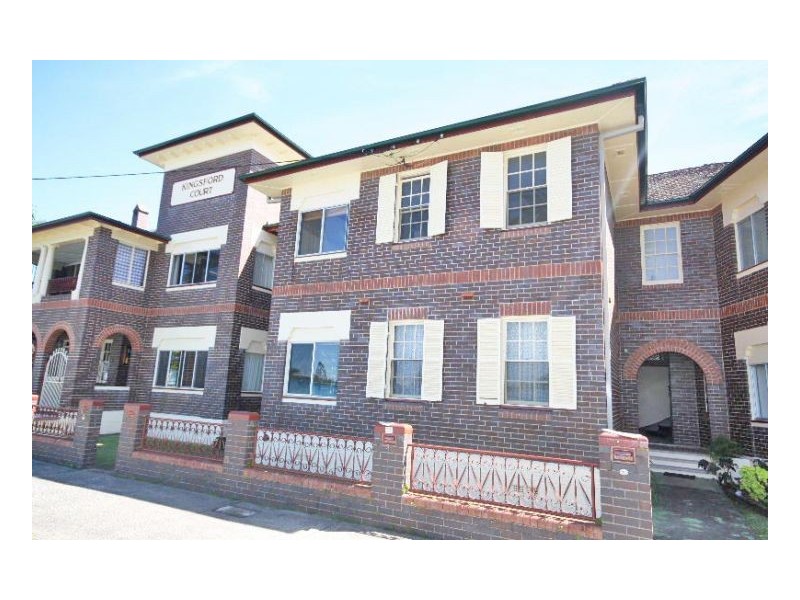
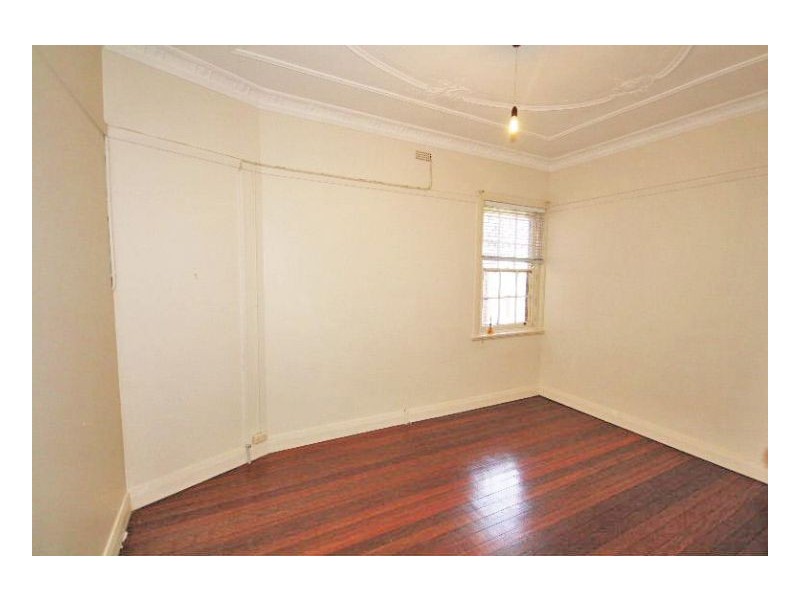
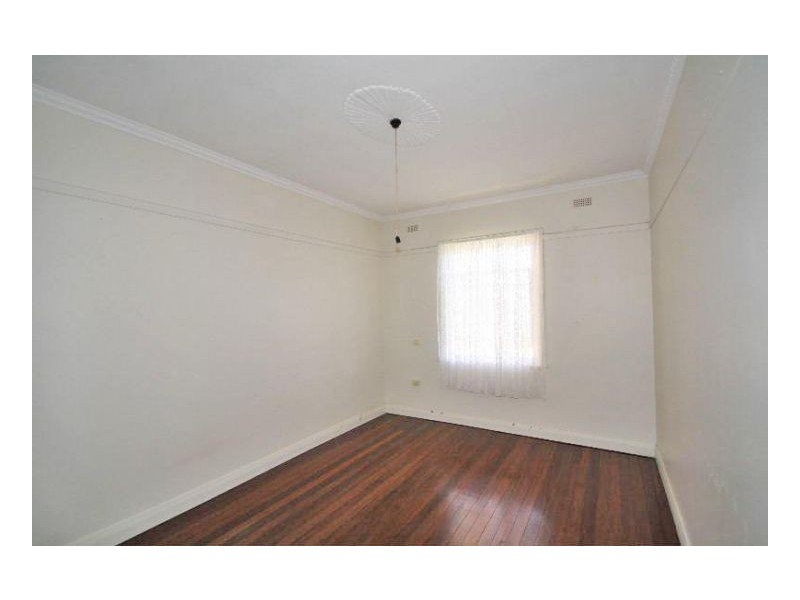
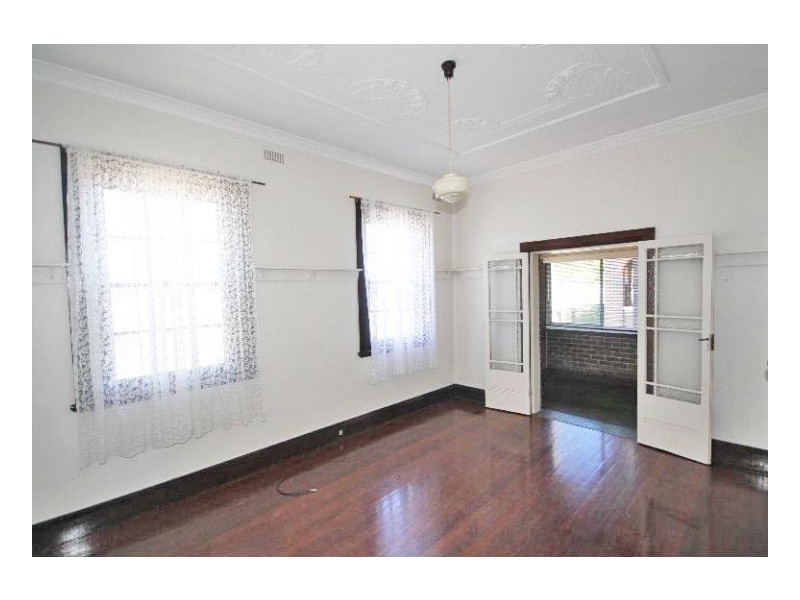
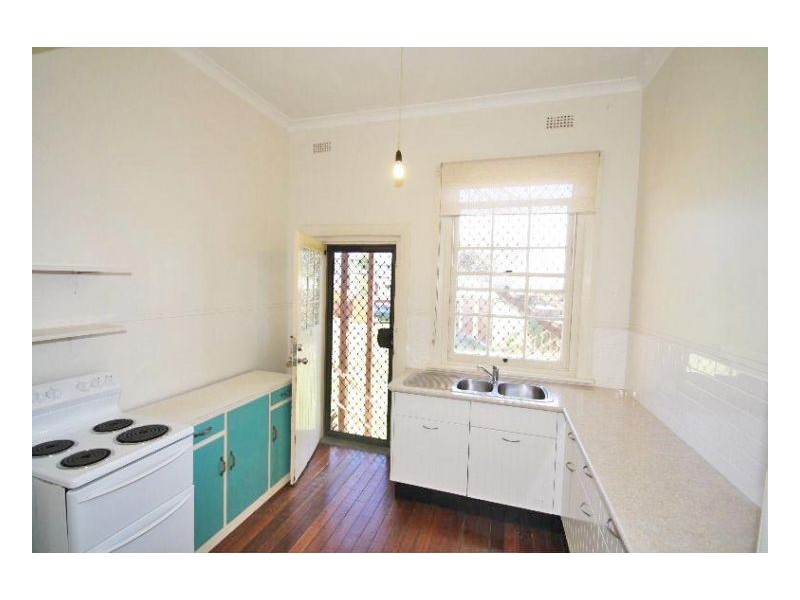
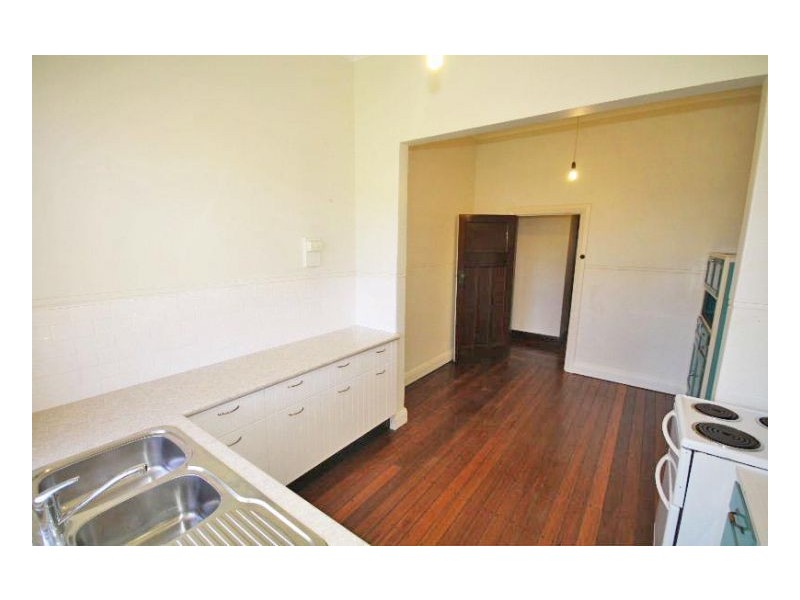
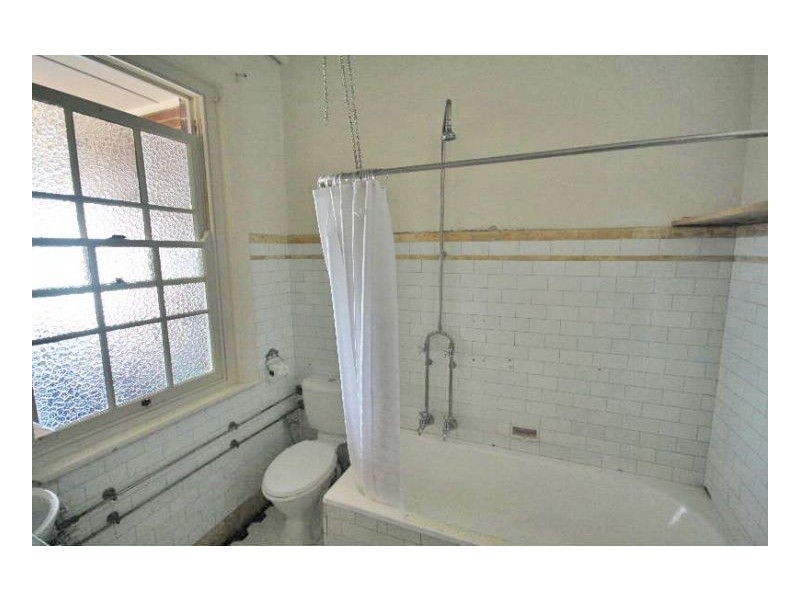
There are approximately 18,049 people living in Murwillumbah but… who are they?
44
49%
51%
Suburb Stats
$834/WK
$250/WK
$382/WK
Value of property in Murwillumbah and nearby suburbs
Murwillumbah
Caniaba
Coraki
Chinderah
Average Home Price$479,070Average Rental Price$346Household Size2.5
Average Home Price$542,321Average Rental Price$318Household Size2.4
Average Home Price$305,645Average Rental Price$281Household Size2.7
Average Home Price$458,464Average Rental Price$379Household Size2.3
Water Useper year per person
0.6mln. litres
State Average 0.74 mln. litres
Nat. Average 0.74 mln. litres
Greenhouse Pollutionper year per person
16.48tonnes
State Average 19.31 tonnes
Nat. Average 20.3 tonnes
Dwelling Types
91%
5%
3%
Most Common Suburb Professions
17% Professio…
15% Technicia…
14% Managers…
12% Labourers…
Nearby schools: murwillumbah community college, mt st patrick college, murwillumbah east primary school, murwillumbah south infants school
Nearby cafes: cenzo cafe, the blue frog, fish bowl cafe, auto cafe
Nearby doctors: rightfoot podiatry & footwear clinics, king street medical centre-dr yabsley robyn, kettle i h, king street medical centre-dr alan secombe
Nearby hospitals: king street medical centre, murwillumbah district hospital, queen street medical centre