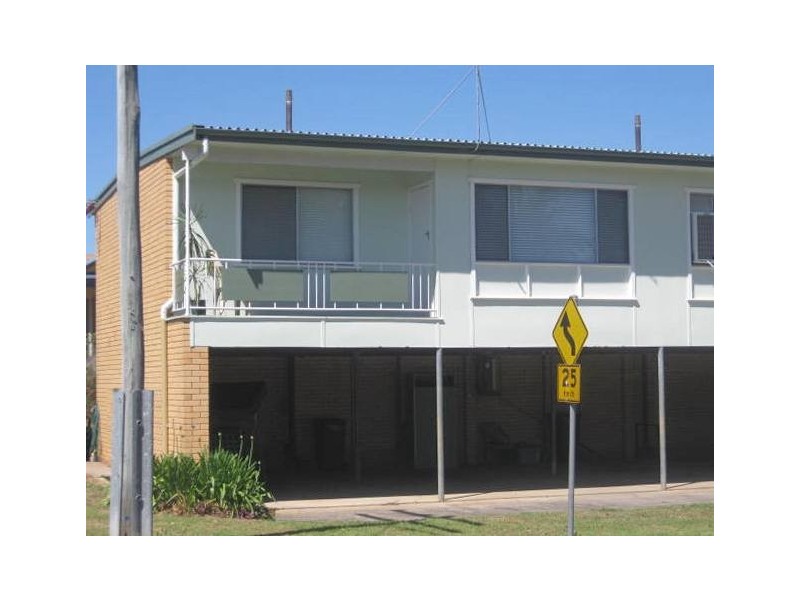
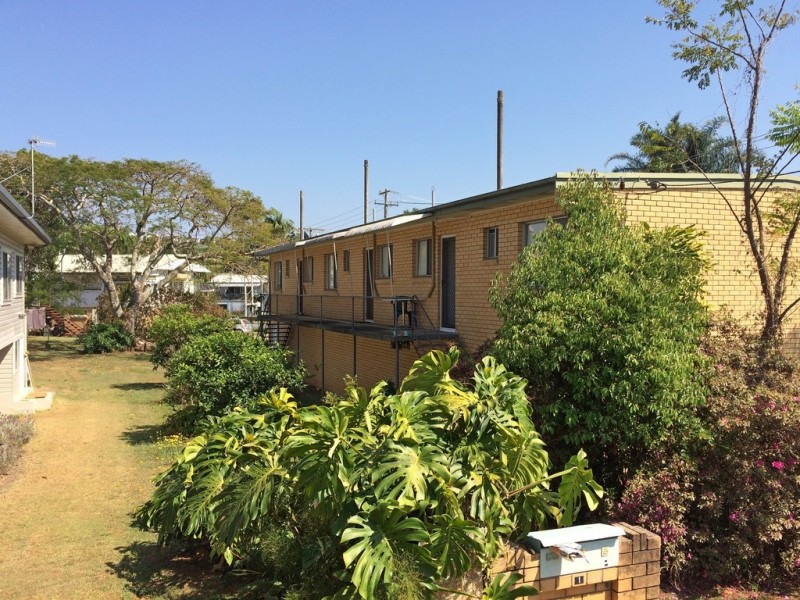
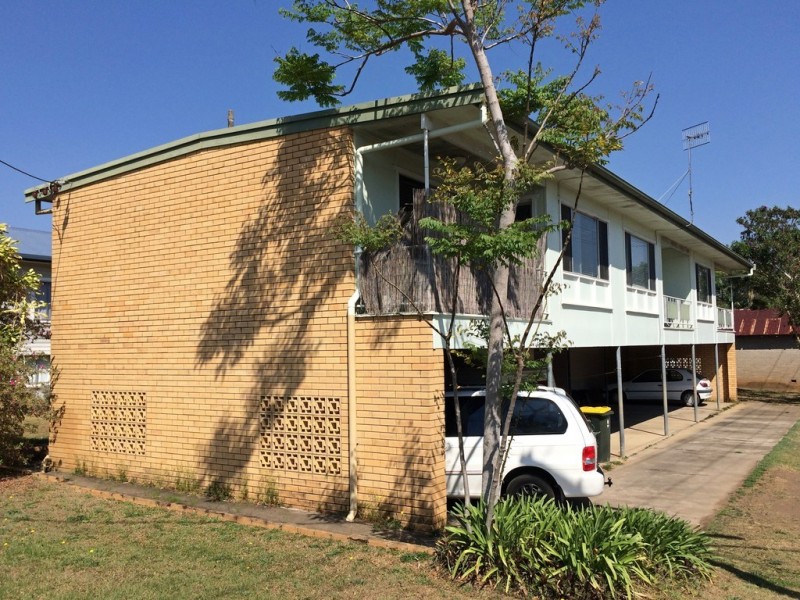
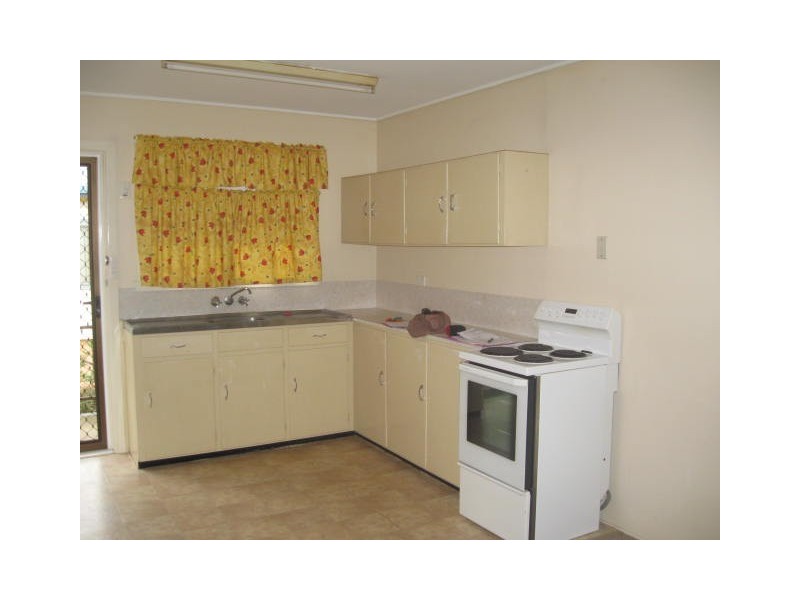
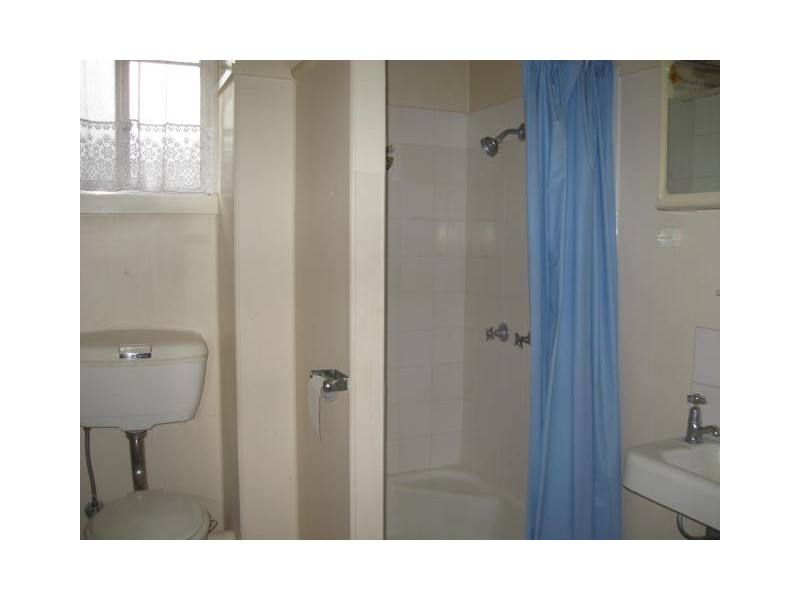
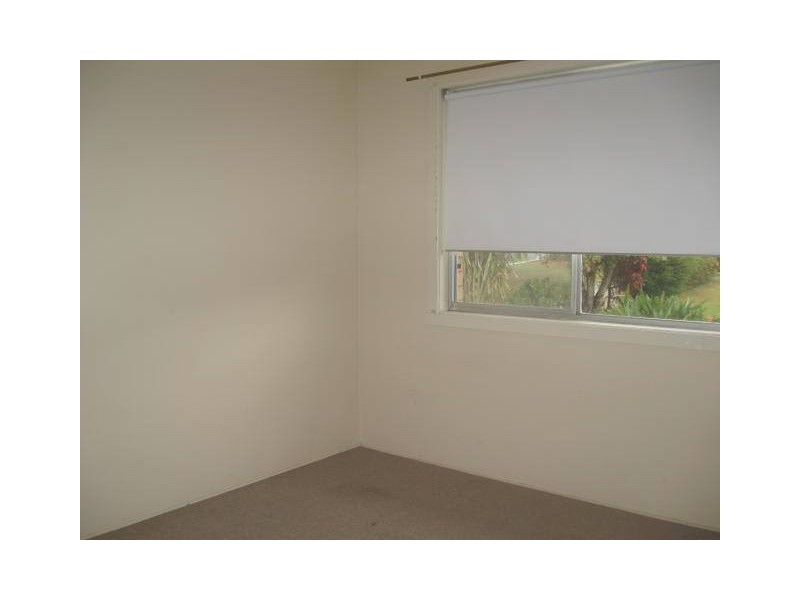
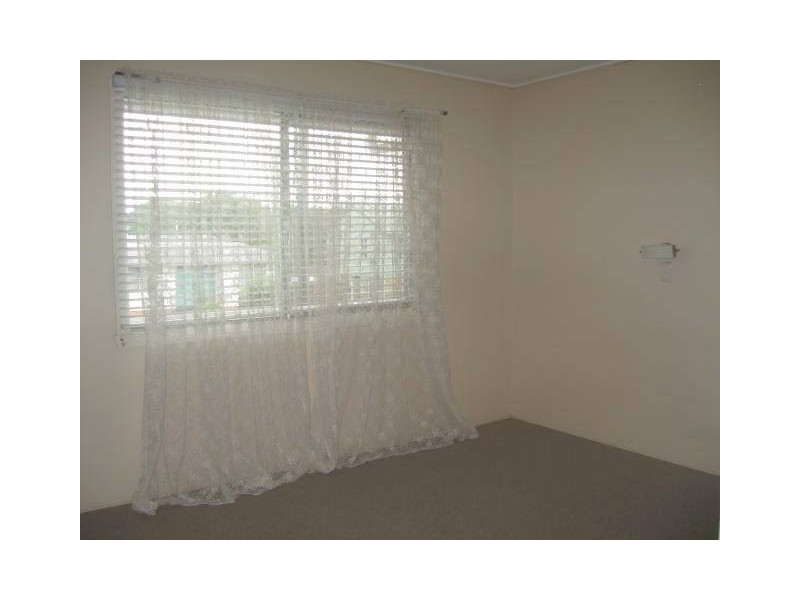
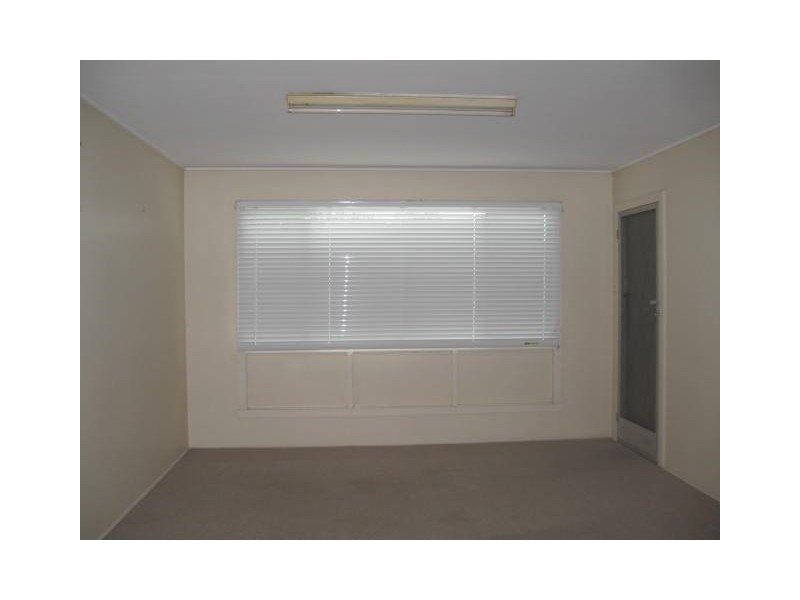
There are approximately 18,049 people living in Murwillumbah but… who are they?
44
49%
51%
Suburb Stats
$834/WK
$250/WK
$382/WK
Value of property in Murwillumbah and nearby suburbs
Murwillumbah
Patchs Beach
Nymboida
Brunswick Heads
Average Home Price$478,633Average Rental Price$346Household Size2.5
Average Home Price$614,500Average Rental Price$465Household Size2.3
Average Home Price$315,036Average Rental Price$434Household Size2.4
Average Home Price$1,148,578Average Rental Price$442Household Size2.4
Water Useper year per person
0.6mln. litres
State Average 0.74 mln. litres
Nat. Average 0.74 mln. litres
Greenhouse Pollutionper year per person
16.48tonnes
State Average 19.31 tonnes
Nat. Average 20.3 tonnes
Dwelling Types
91%
5%
3%
Most Common Suburb Professions
17% Professio…
15% Technicia…
14% Managers…
12% Labourers…
Nearby schools: murwillumbah high school, mt st patrick college, murwillumbah east primary school, murwillumbah community college
Nearby cafes: king street cafe, the blue frog, fish bowl cafe, sugar beat cafe
Nearby doctors: king street dental practice - dr. evans michael, kettle i h, rightfoot podiatry & footwear clinics, king street medical centre-warne douglas
Nearby hospitals: king street medical centre, murwillumbah district hospital, queen street medical centre