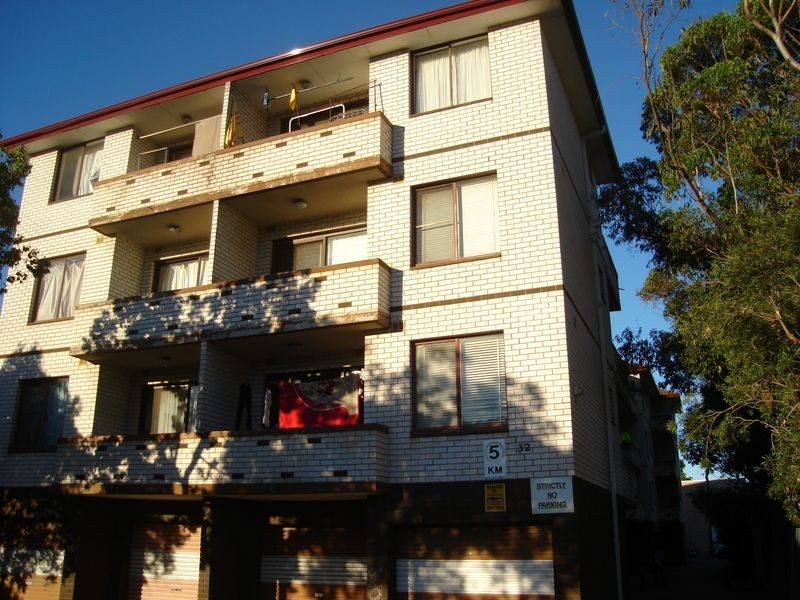
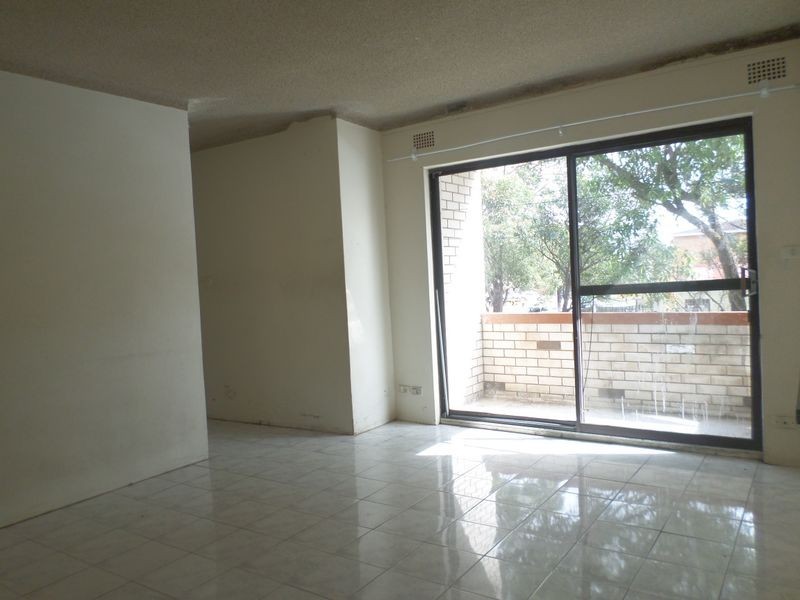
Cabramatta NSW 2166 2 br unit 1st floor $330 / Wk 2 1 1 Listing ID: 16530238 Other properties to rent near Cabramatta NSW 2166 12/22 Mcburney Road, Cabramatta NSW 2166 14/85 Longfield street, Cabramatta NSW 2166 1/21 Hughes Street, Cabramatta NSW 2166 9/124-126 John St, Cabramatta NSW 2166 41B Alick Street, Cabramatta NSW 2166 Location THIS PROPERTY WAS LEASED Enquiry about this property Name* Email* Phone* Message* Send me regular newsletters from Homehound Have agents get in touch about similar properties within the area What is 8 + 20?* Receive email alerts for properties like this Email alerts Email* Send me regular newsletters from Homehound. Have agents get in touch about similar properties within the area What is 8 + 20?*