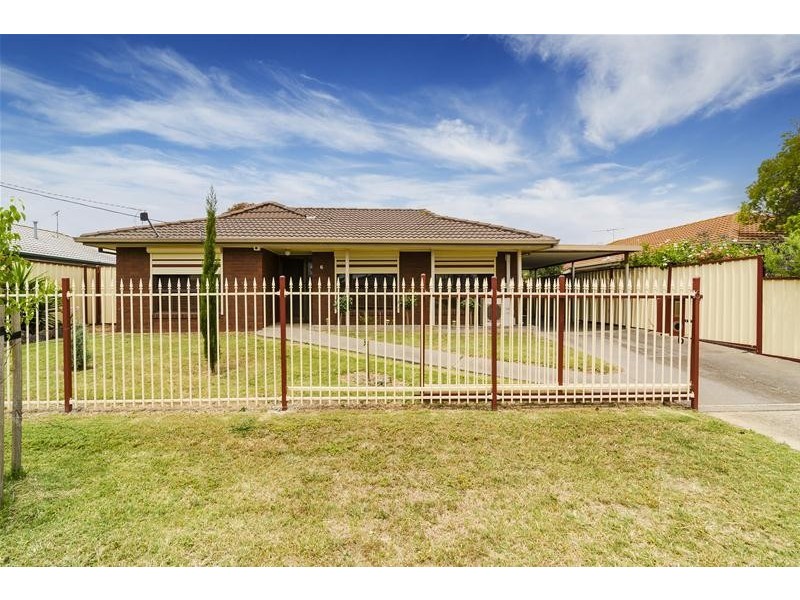
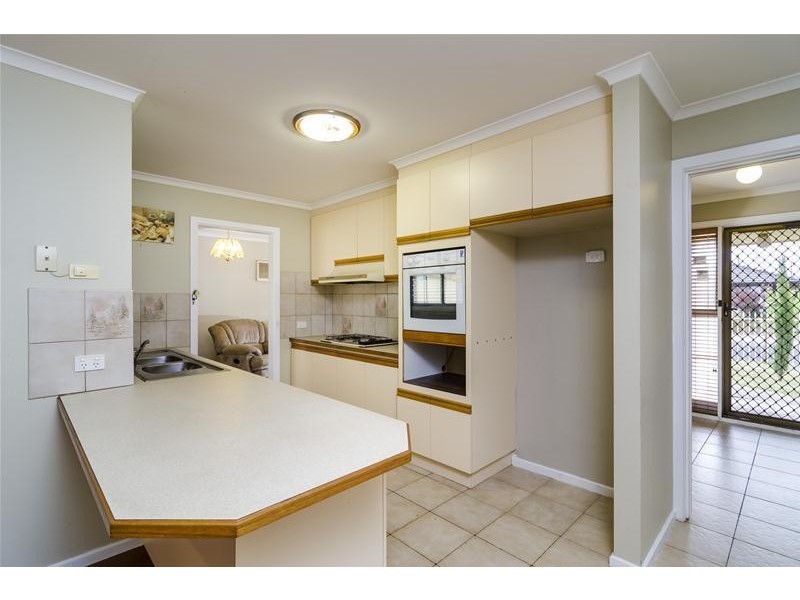
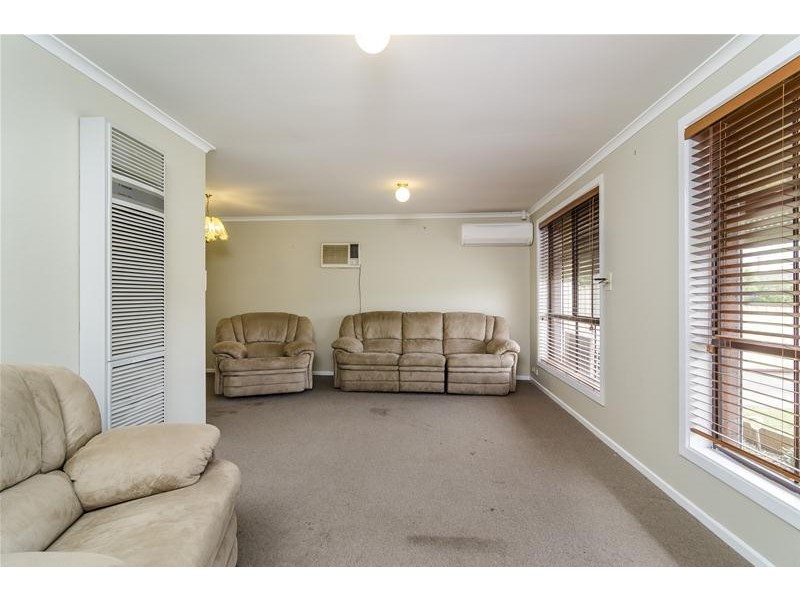
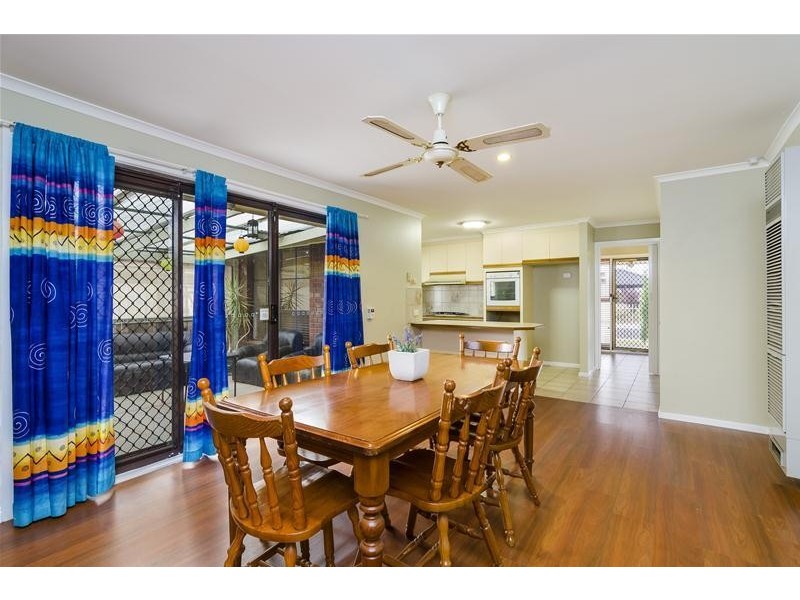
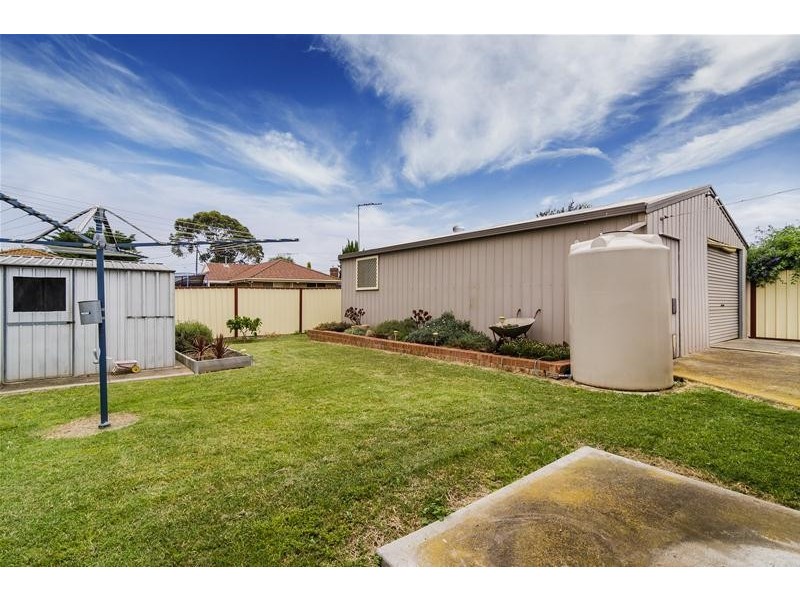
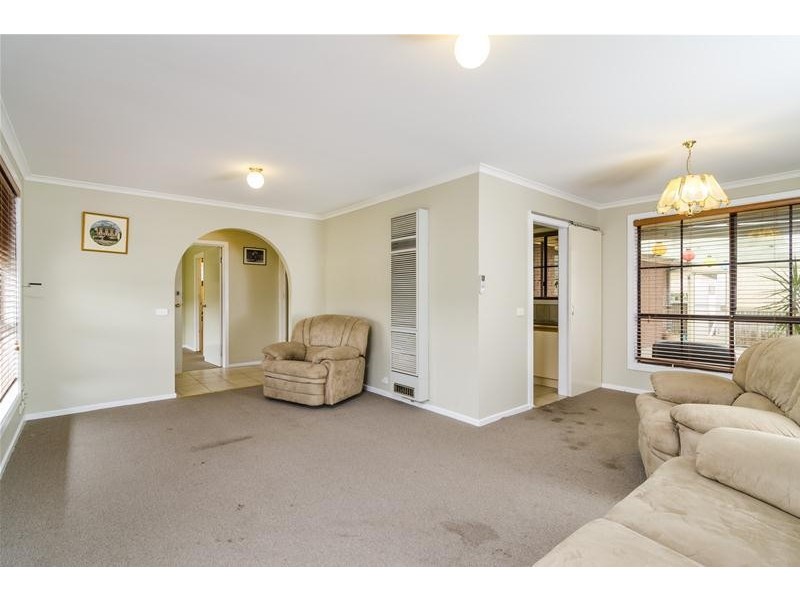
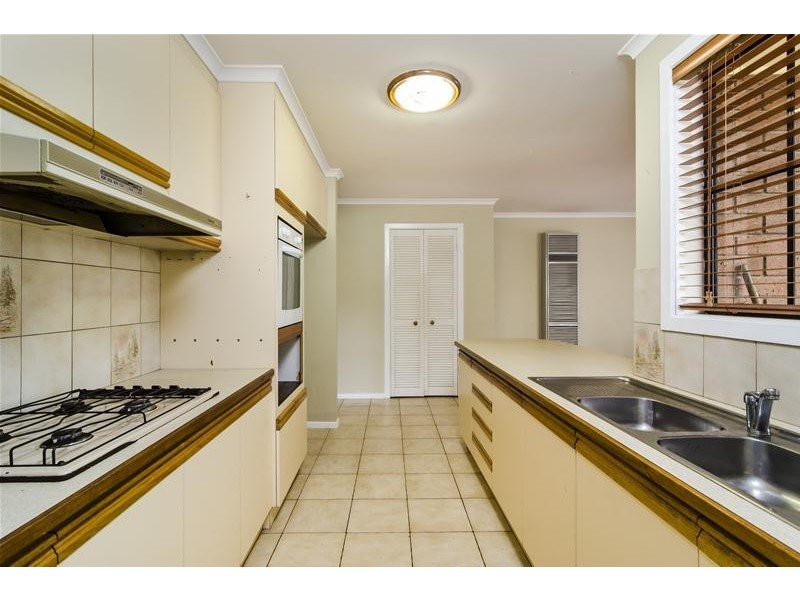
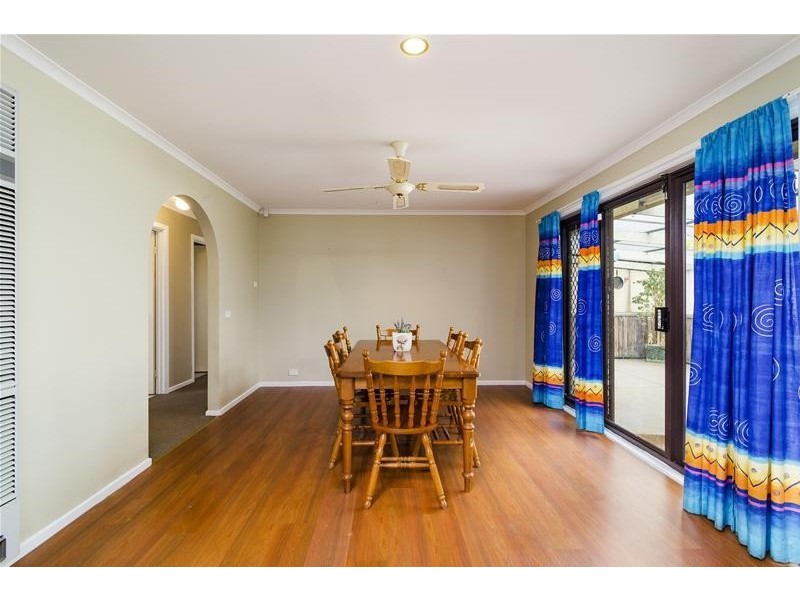
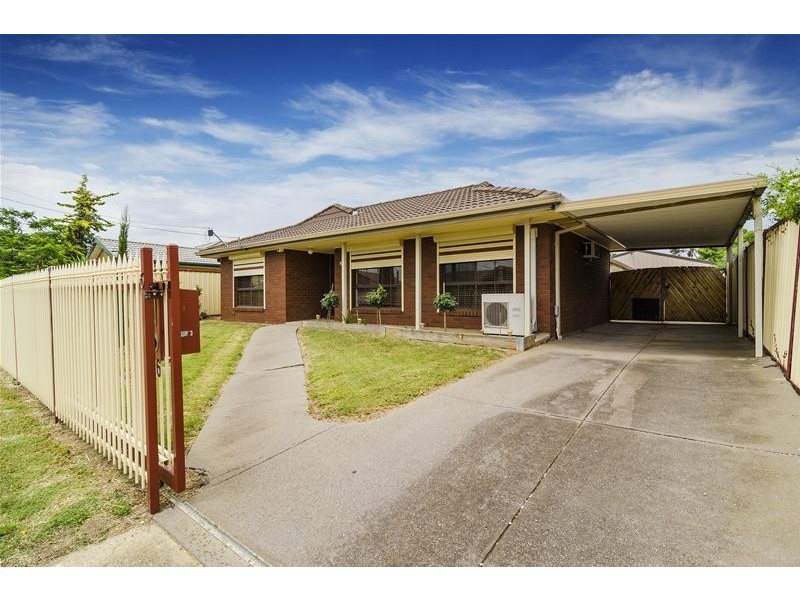
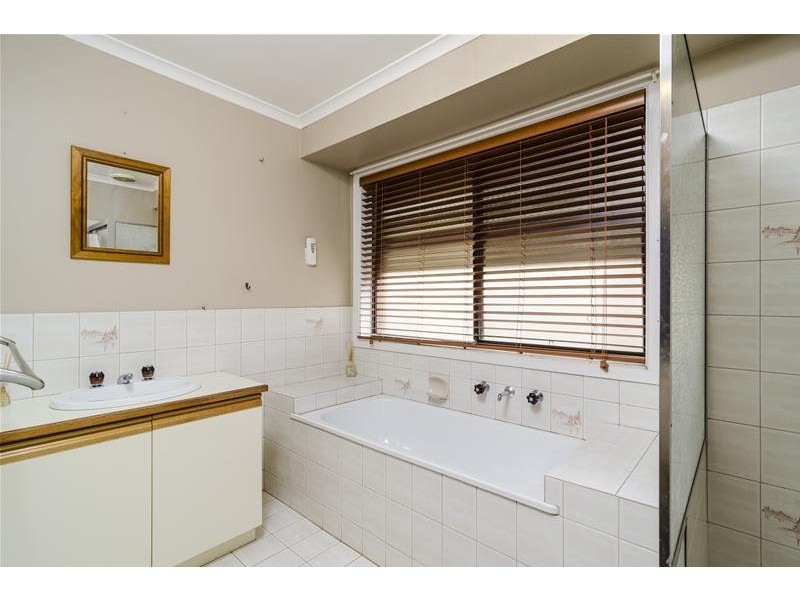
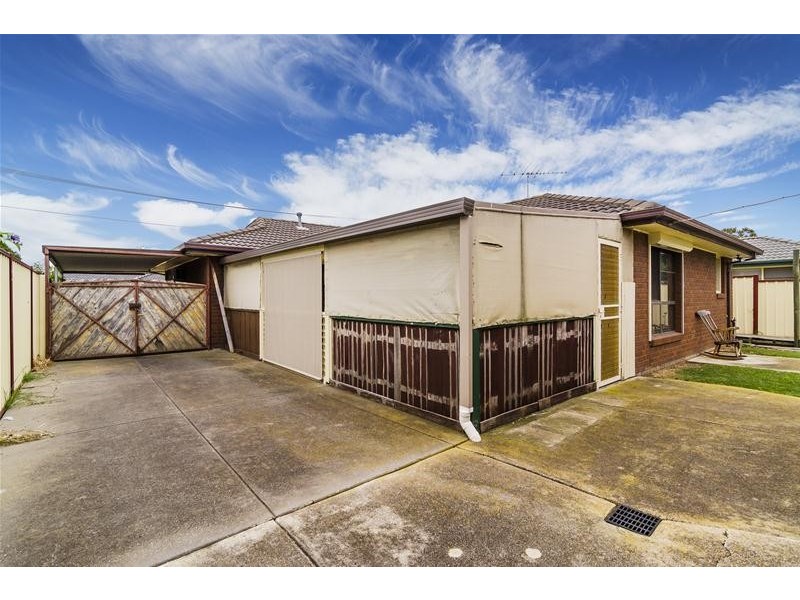
6 Greenshank Court, Werribee VIC 3030 MAKE THIS YOUR OWN $275,000 to $300,000 Listing history: 29 May, 2008 26 Feb, 2014 3 2 5 Listing ID: 24358638 Location THIS PROPERTY WAS WITHDRAWN Enquiry about this property Name* Email* Phone* Message* Send me regular newsletters from Homehound Have agents get in touch about similar properties within the area What is 8 + 20?* Receive email alerts for properties like this Email alerts Email* Send me regular newsletters from Homehound. Have agents get in touch about similar properties within the area What is 8 + 20?*