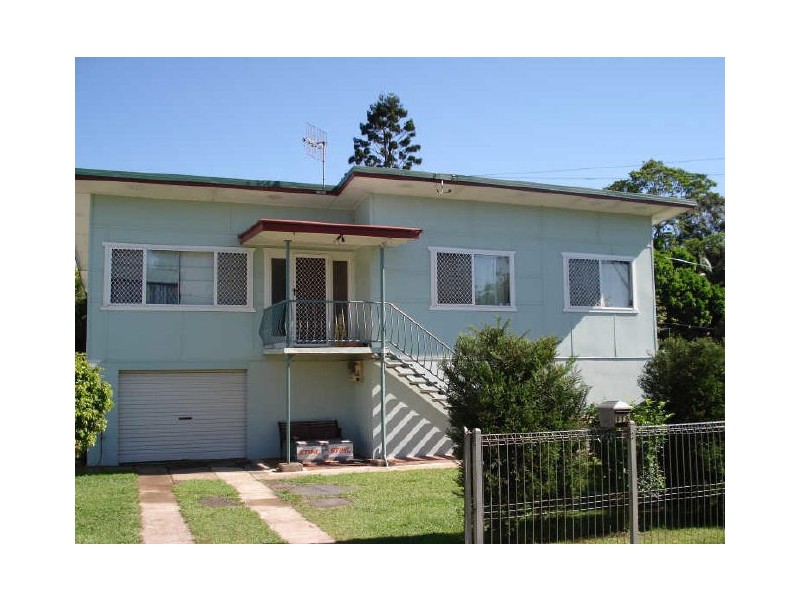
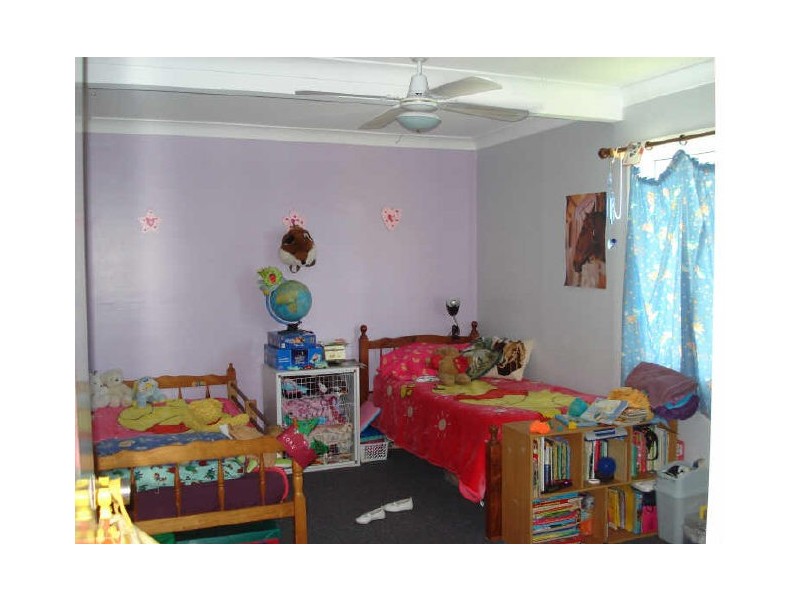
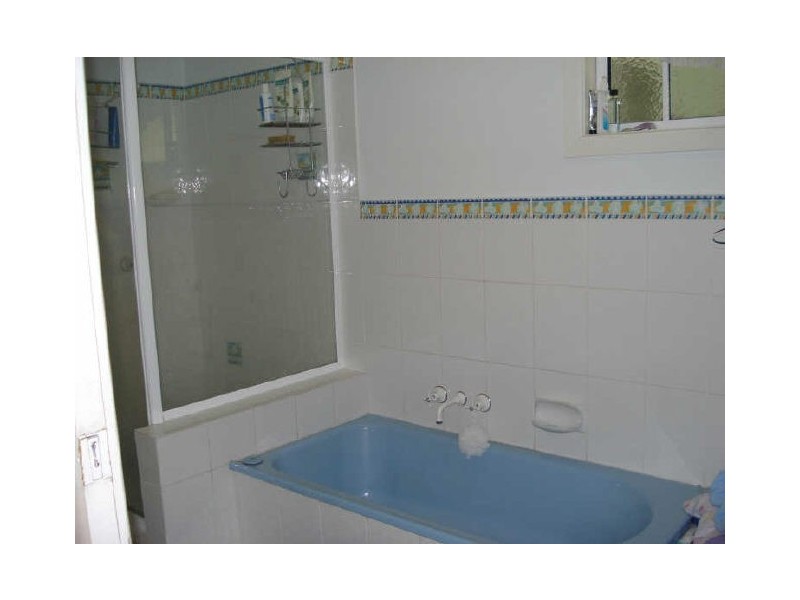
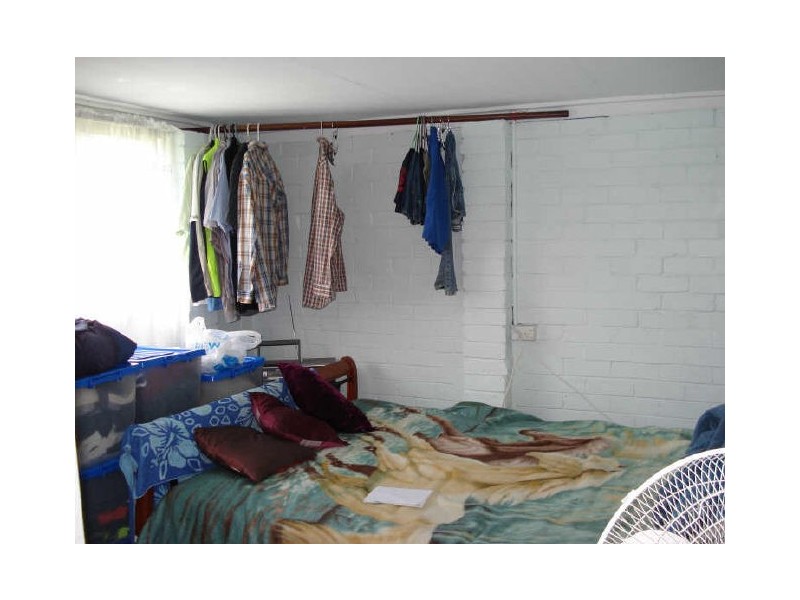
Murwillumbah NSW 2484 BIG FAMILY? NO WORRIES! $420,000 5 2 0 Listing ID: 8069911 Other properties for sale near Murwillumbah NSW 2484 1 Eveleigh Street, Murwillumbah NSW 2484 1 Eveleigh Street, Murwillumbah NSW 2484 12 Charles Street, Murwillumbah NSW 2484 4-6 Frangela Drive, Murwillumbah NSW 2484 4-6 Frangela Drive, Murwillumbah NSW 2484 Location THIS PROPERTY WAS WITHDRAWN Enquiry about this property Name* Email* Phone* Message* Send me regular newsletters from Homehound Have agents get in touch about similar properties within the area What is 8 + 20?* Receive email alerts for properties like this Email alerts Email* Send me regular newsletters from Homehound. Have agents get in touch about similar properties within the area What is 8 + 20?*