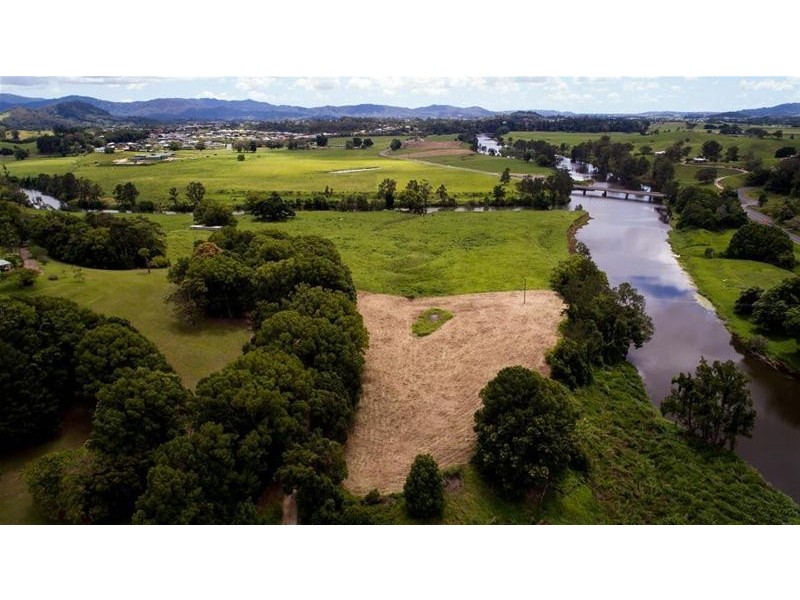
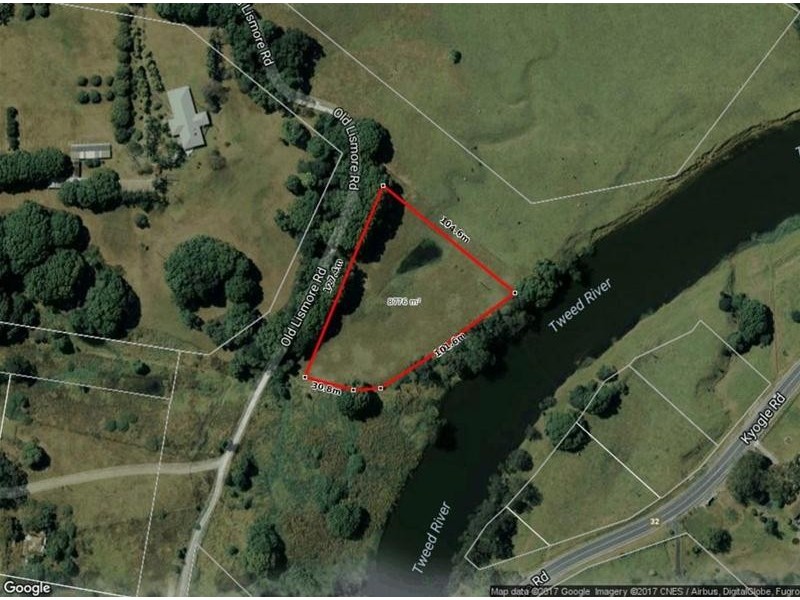
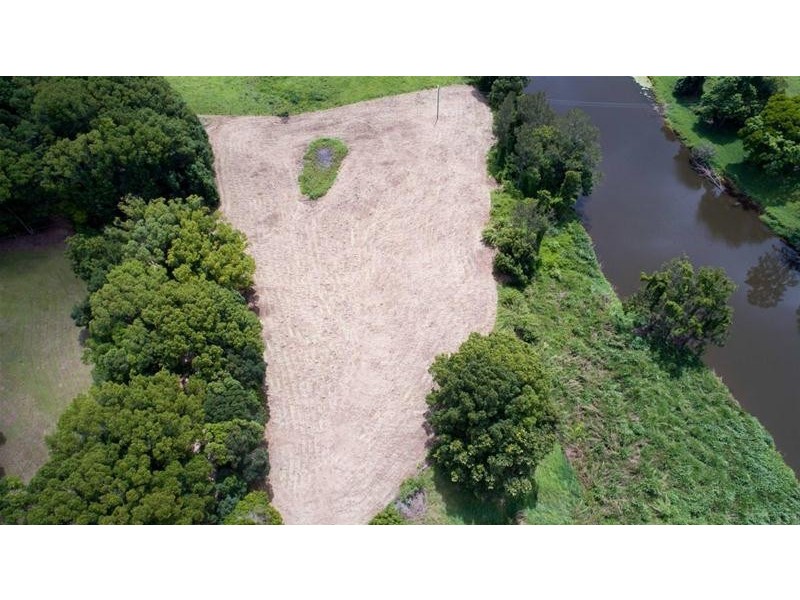
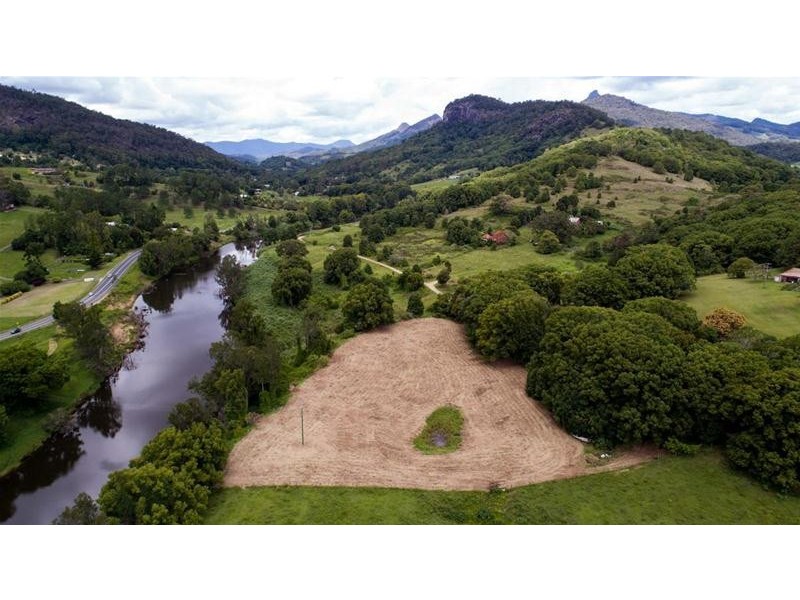
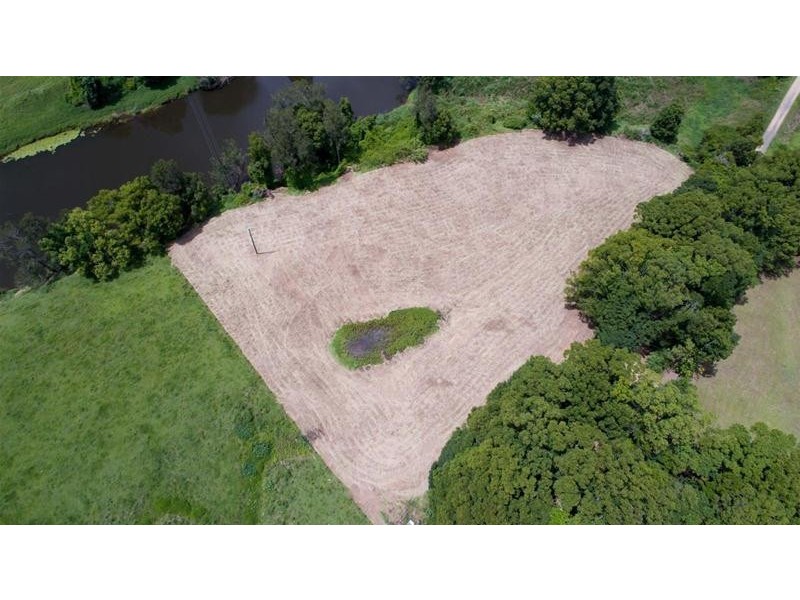
There are approximately 18,049 people living in Murwillumbah but… who are they?
44
49%
51%
Suburb Stats
$834/WK
$250/WK
$382/WK
Value of property in Murwillumbah and nearby suburbs
Murwillumbah
Brooms Head
Mullumbimby
Tumbulgum
Average Home Price$479,070Average Rental Price$346Household Size2.5
Average Home Price$551,200Average Rental Price$802Household Size2.4
Average Home Price$889,914Average Rental Price$597Household Size2.4
Average Home Price$547,085Average Rental Price$442Household Size2.7
Water Useper year per person
0.6mln. litres
State Average 0.74 mln. litres
Nat. Average 0.74 mln. litres
Greenhouse Pollutionper year per person
16.48tonnes
State Average 19.31 tonnes
Nat. Average 20.3 tonnes
Dwelling Types
91%
5%
3%
Most Common Suburb Professions
17% Professio…
15% Technicia…
14% Managers…
12% Labourers…
Nearby schools: murwillumbah south infants school, mt st patrick college, murwillumbah community college, murwillumbah high school
Nearby cafes: king street cafe, auto cafe, fish bowl cafe, cenzo cafe
Nearby doctors: king street medical centre-dr alan secombe, qml pathology, king street dental practice - dr. evans michael, king street medical centre-warne douglas
Nearby hospitals: murwillumbah district hospital, king street medical centre, queen street medical centre