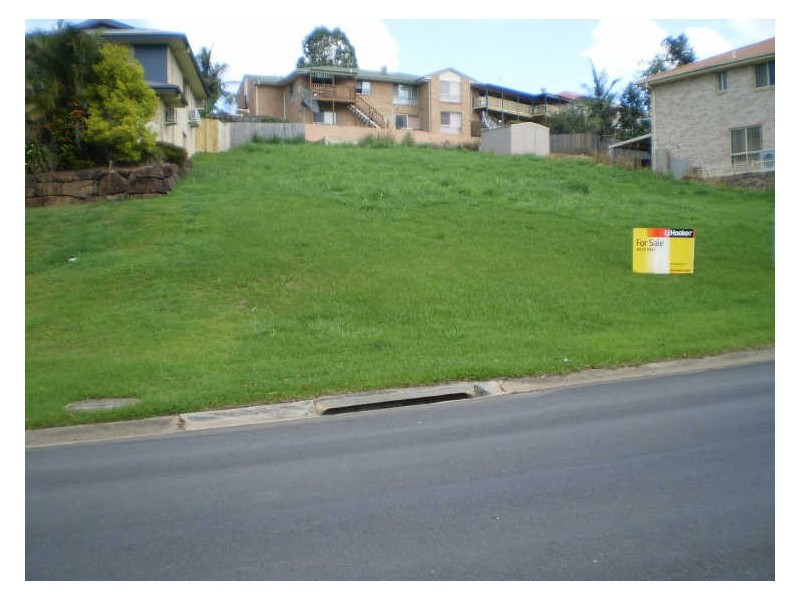
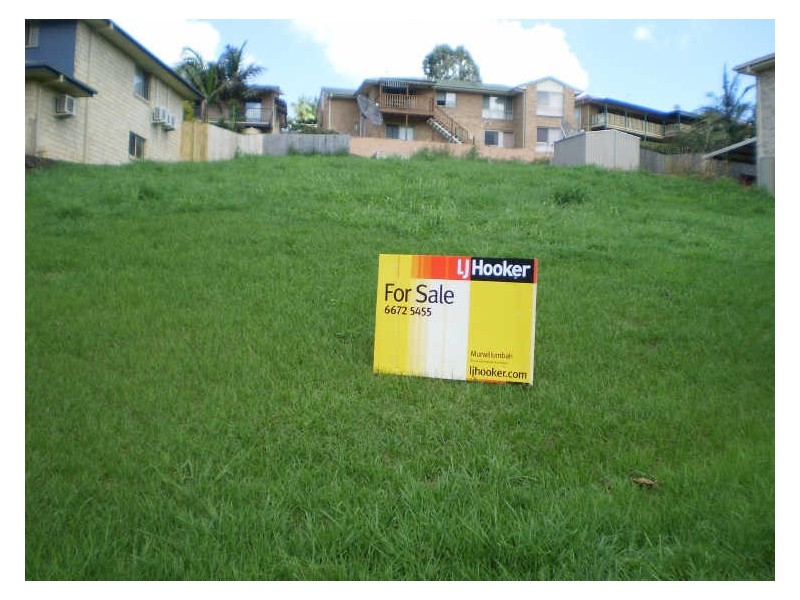
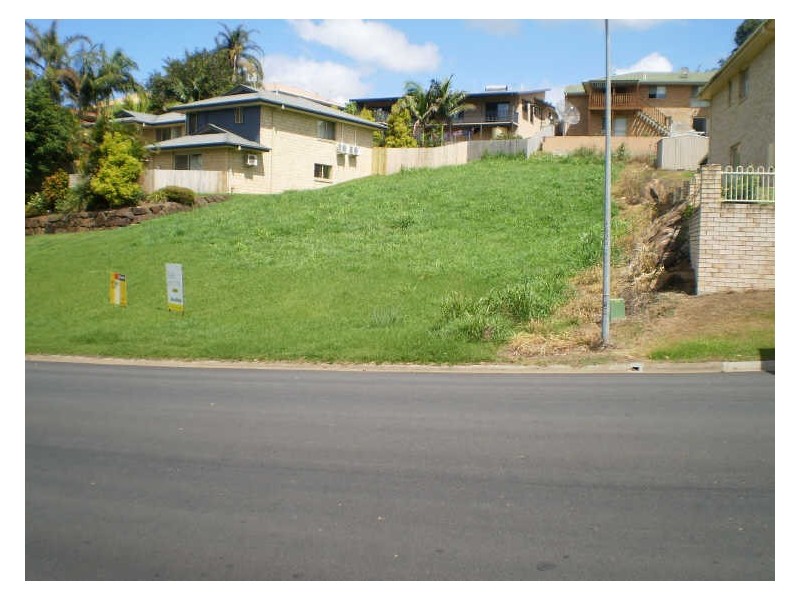
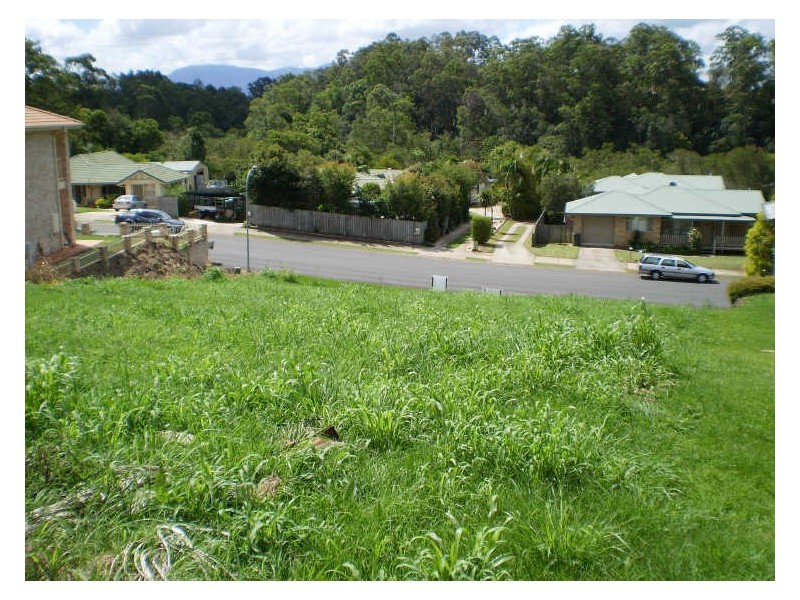
There are approximately 18,049 people living in Murwillumbah but… who are they?
44
49%
51%
Suburb Stats
$834/WK
$250/WK
$382/WK
Value of property in Murwillumbah and nearby suburbs
Murwillumbah
Patchs Beach
Lennox Head
Nimbin
Average Home Price$479,070Average Rental Price$346Household Size2.5
Average Home Price$614,500Average Rental Price$465Household Size2.3
Average Home Price$928,442Average Rental Price$545Household Size2.3
Average Home Price$463,353Average Rental Price$314Household Size2.4
Water Useper year per person
0.6mln. litres
State Average 0.74 mln. litres
Nat. Average 0.74 mln. litres
Greenhouse Pollutionper year per person
16.48tonnes
State Average 19.31 tonnes
Nat. Average 20.3 tonnes
Dwelling Types
91%
5%
3%
Most Common Suburb Professions
17% Professio…
15% Technicia…
14% Managers…
12% Labourers…
Nearby schools: mt st patrick college, murwillumbah community college, murwillumbah high school, murwillumbah south infants school
Nearby cafes: the modern grocer, the blue frog, dabelles cafe, auto cafe
Nearby doctors: king street medical centre- dr. j. stephenson, king street dental practice, king street medical centre-jenkins helen, king street dental practice - dr. evans michael
Nearby hospitals: murwillumbah district hospital, king street medical centre, queen street medical centre