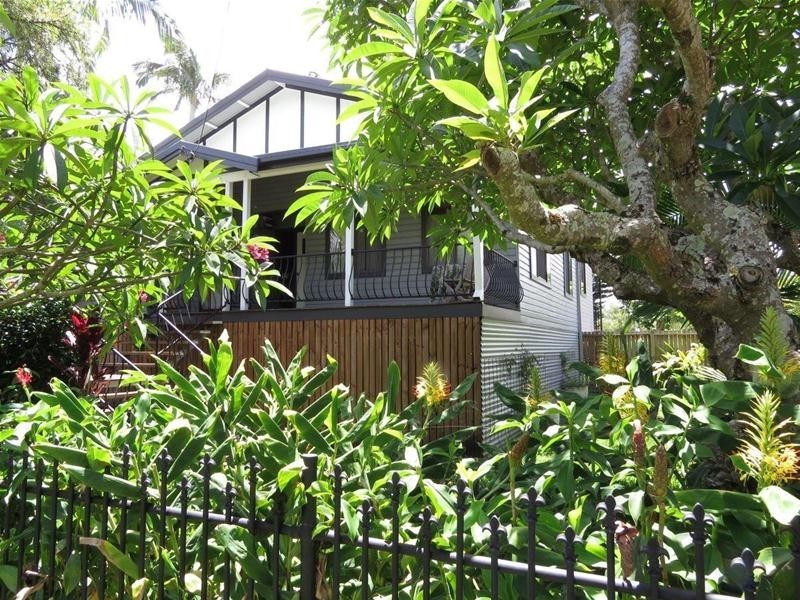
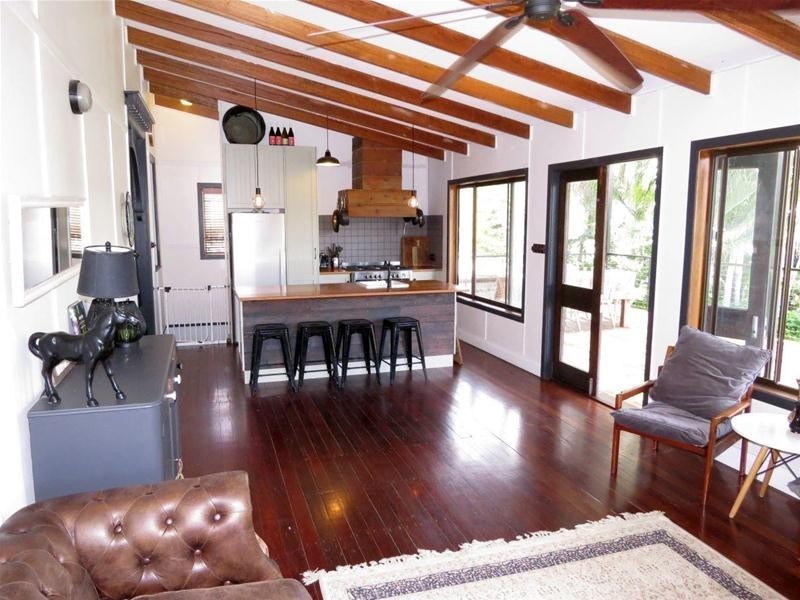
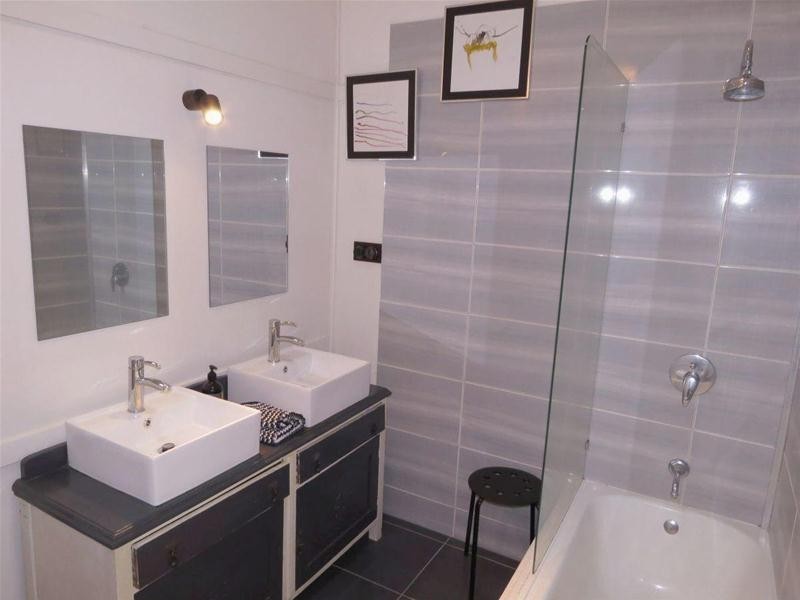
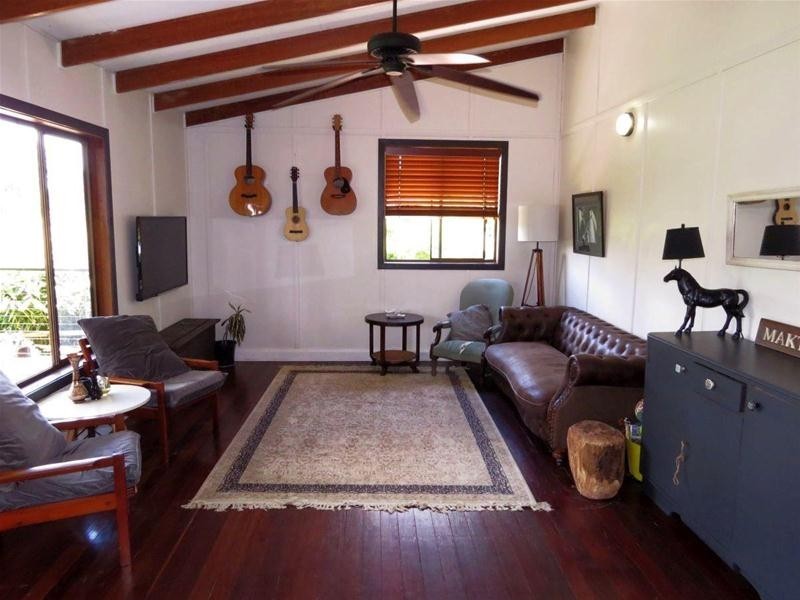
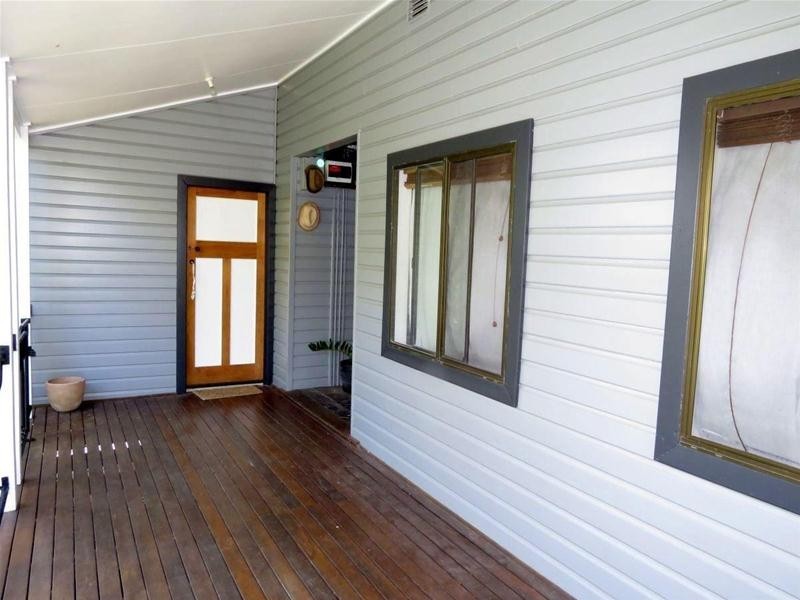
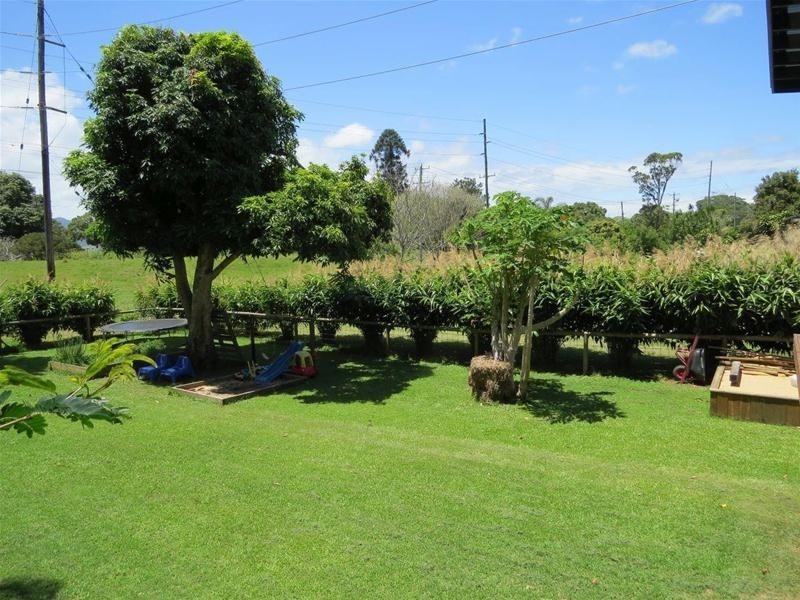
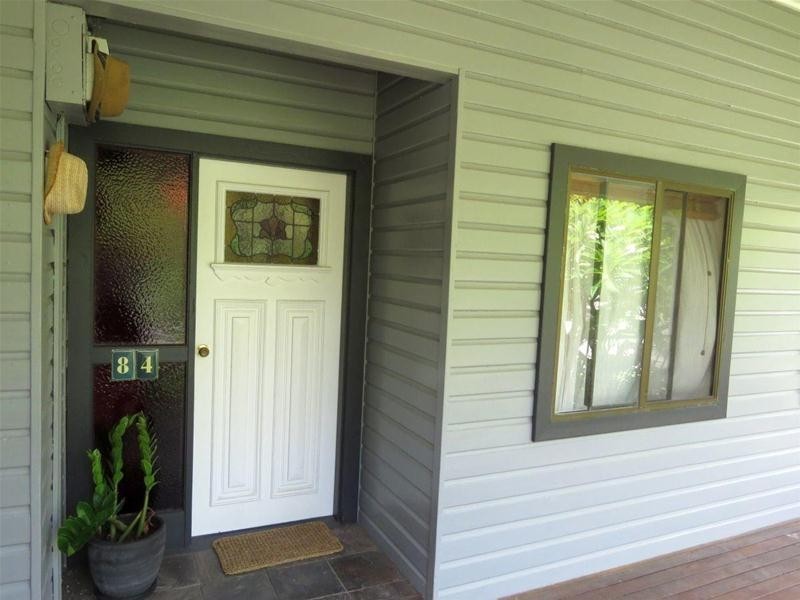
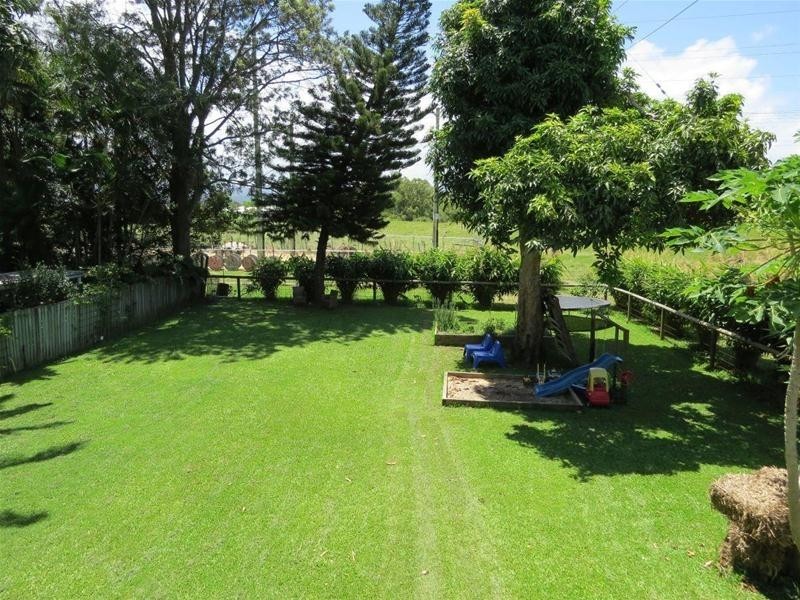
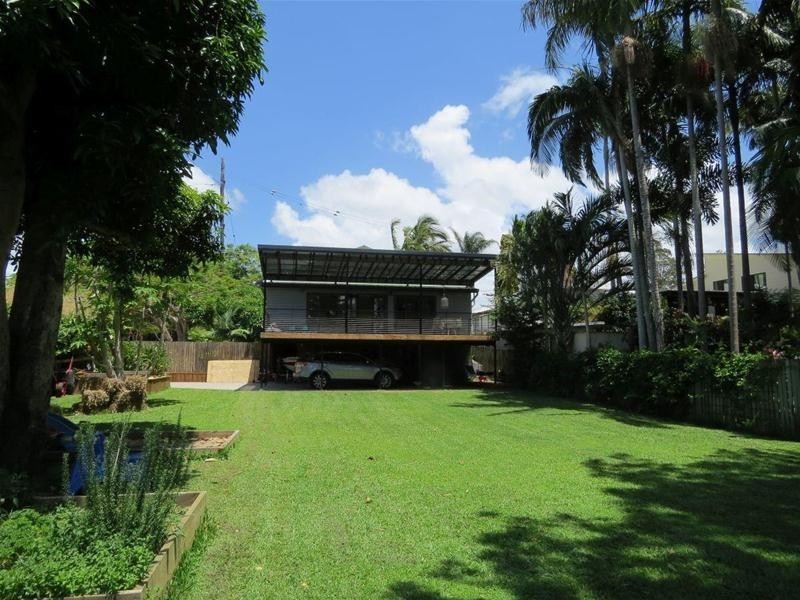
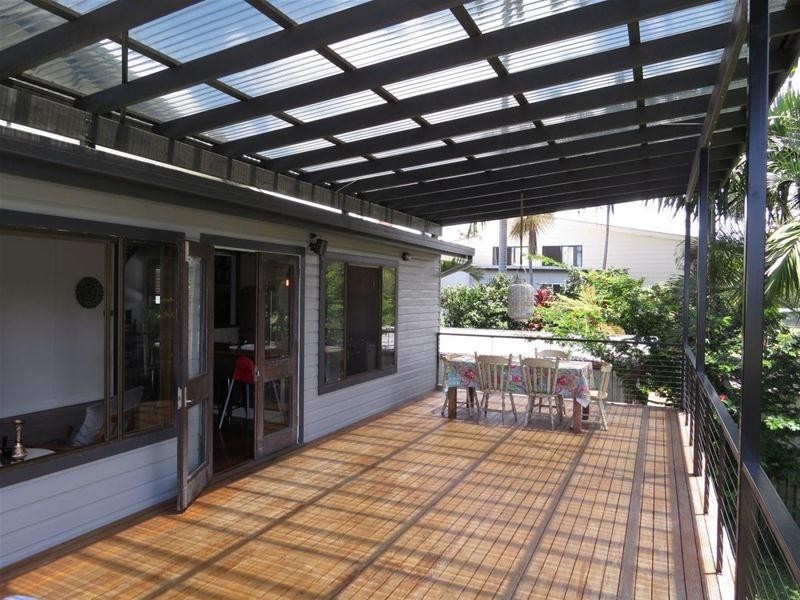
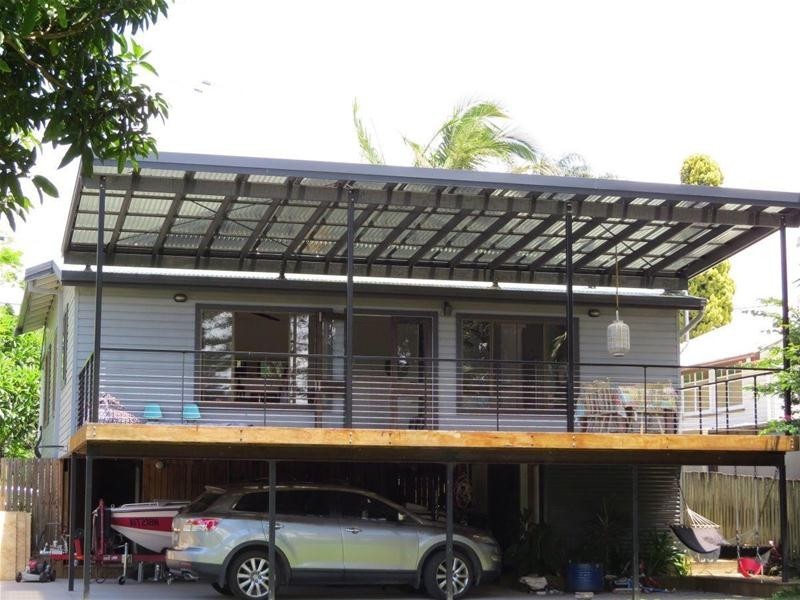
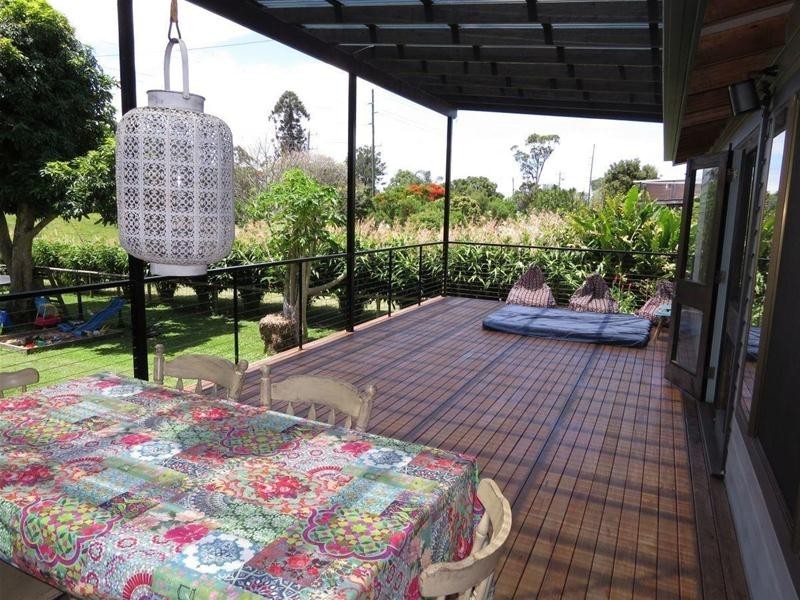
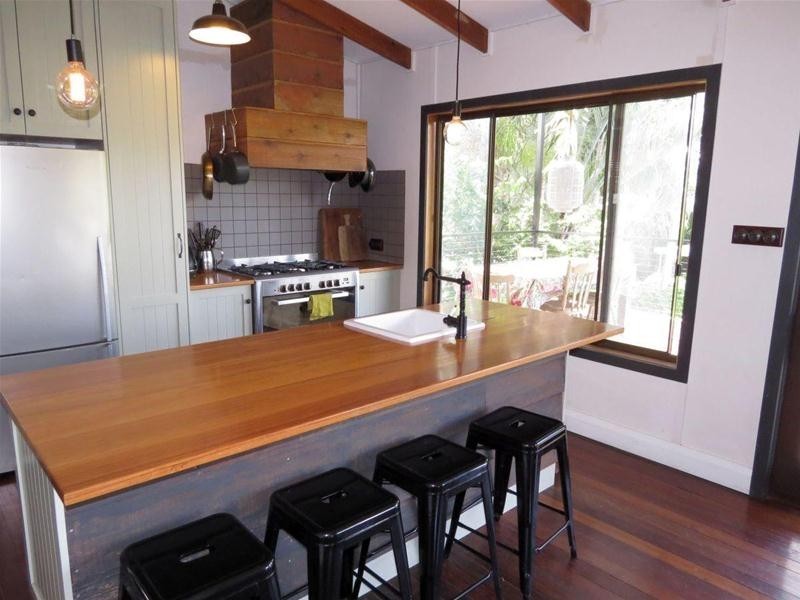
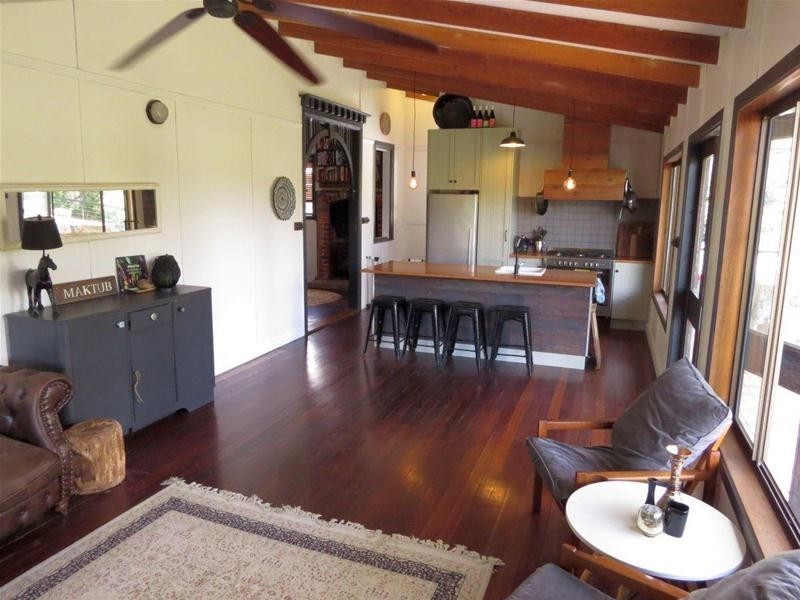
84 Tumbulgum Road, Murwillumbah NSW 2484 Room for Everyone $599,000 Listing history: 5 Jul, 2010 23 Jan, 2017 16 Oct, 2017 13 Dec, 2021 5 2 4 Listing ID: 34999853 Other properties for sale near 84 Tumbulgum Road, Murwillumbah NSW 2484 1 Tumbulgum Road, Murwillumbah NSW 2484 84 TUMBULGUM ROAD, Murwillumbah NSW 2484 45 Tumbulgum Road, Murwillumbah NSW 2484 58 Tumbulgum Road, Murwillumbah NSW 2484 141B Byangum Road, Murwillumbah NSW 2484 Location THIS PROPERTY WAS WITHDRAWN Enquiry about this property Name* Email* Phone* Message* Send me regular newsletters from Homehound Have agents get in touch about similar properties within the area What is 8 + 20?* Receive email alerts for properties like this Email alerts Email* Send me regular newsletters from Homehound. Have agents get in touch about similar properties within the area What is 8 + 20?*