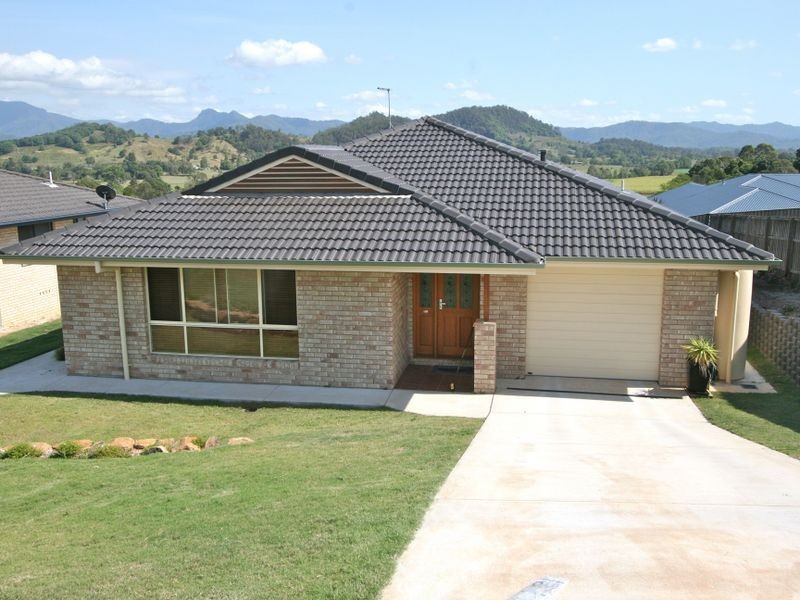
There are approximately 18,049 people living in Murwillumbah but… who are they?
44
49%
51%
Suburb Stats
$834/WK
$250/WK
$382/WK
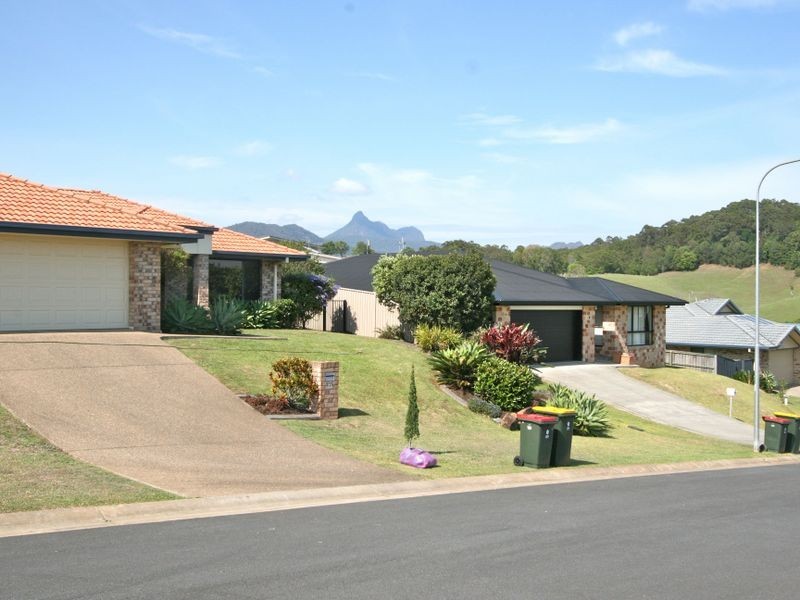
Value of property in Murwillumbah and nearby suburbs
Murwillumbah
Arrawarra Headland
Lennox Head
Brushgrove
Average Home Price$479,070Average Rental Price$346Household Size2.5
Average Home Price$709,769Average Rental Price$472Household Size2.5
Average Home Price$928,442Average Rental Price$545Household Size2.3
Average Home Price$460,239Average Rental Price$327Household Size2.4
Water Useper year per person
0.6mln. litres
State Average 0.74 mln. litres
Nat. Average 0.74 mln. litres
Greenhouse Pollutionper year per person
16.48tonnes
State Average 19.31 tonnes
Nat. Average 20.3 tonnes
Dwelling Types
91%
5%
3%
Most Common Suburb Professions
17% Professio…
15% Technicia…
14% Managers…
12% Labourers…
Nearby schools: murwillumbah east primary school, murwillumbah south infants school, mt st patrick college, murwillumbah high school
Nearby cafes: the blue frog, sugar beat cafe, dabelles cafe, auto cafe
Nearby doctors: king street medical centre-jenkins helen, advanced radiology clinics murwillumbah, qml pathology, king street medical centre-dr john moran
Nearby hospitals: king street medical centre, queen street medical centre, murwillumbah district hospital