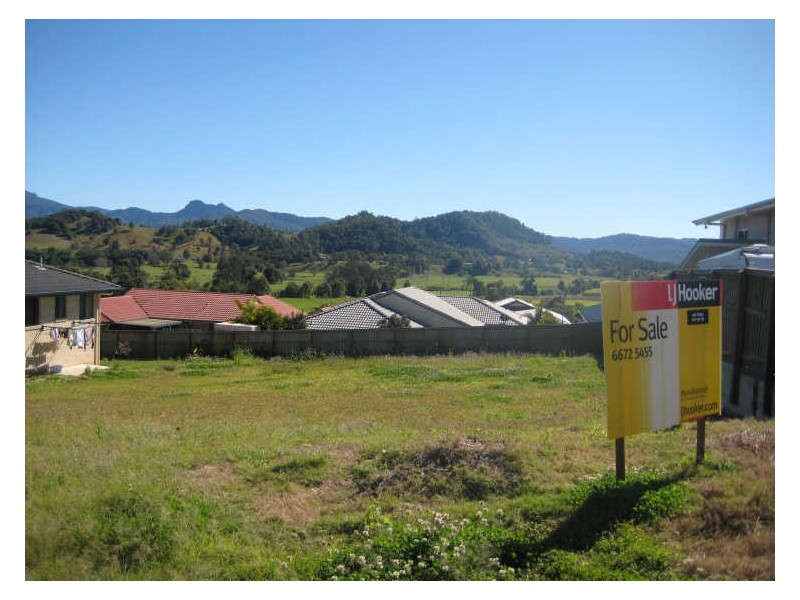
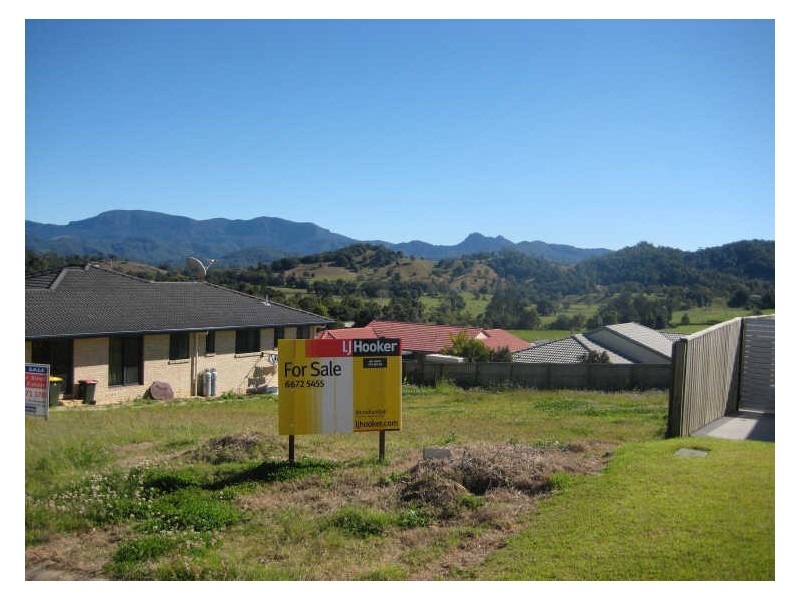
8 Mount Ballow Av, Murwillumbah NSW 2484 KNOW WHO YOUR NEIGHBOURS ARE! $220,000 Listing history: 23 Sep, 2010 0 0 0 Listing ID: 5908562 Other properties for sale near 8 Mount Ballow Av, Murwillumbah NSW 2484 3 MOUNT BALLOW AVENUE, Murwillumbah NSW 2484 Location THIS PROPERTY WAS WITHDRAWN Enquiry about this property Name* Email* Phone* Message* Send me regular newsletters from Homehound Have agents get in touch about similar properties within the area What is 8 + 20?* Receive email alerts for properties like this Email alerts Email* Send me regular newsletters from Homehound. Have agents get in touch about similar properties within the area What is 8 + 20?*