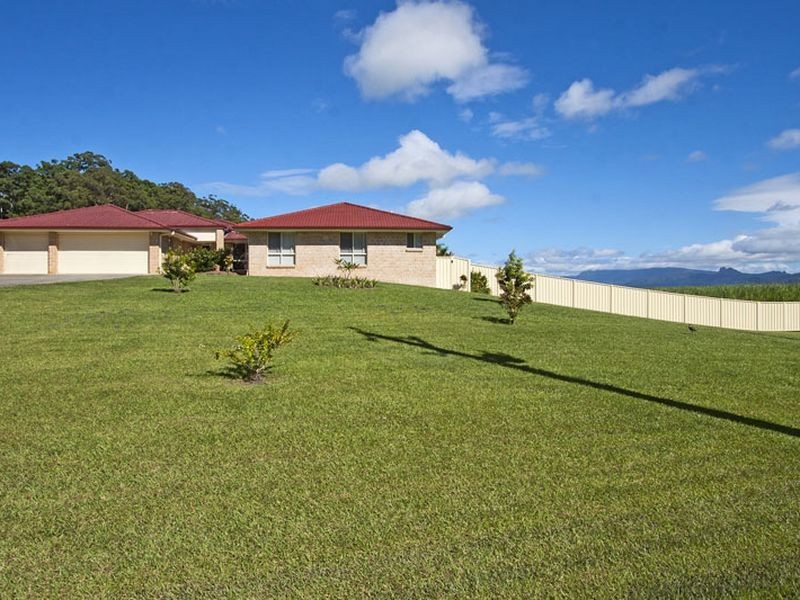
There are approximately 18,049 people living in Murwillumbah but… who are they?
44
49%
51%
Suburb Stats
$834/WK
$250/WK
$382/WK
Value of property in Murwillumbah and nearby suburbs
Murwillumbah
Townsend
Clunes
Gulmarrad
Average Home Price$479,070Average Rental Price$346Household Size2.5
Average Home Price$374,149Average Rental Price$589Household Size2.4
Average Home Price$681,874Average Rental Price$475Household Size2.4
Average Home Price$494,664Average Rental Price$1,136Household Size2.4
Water Useper year per person
0.6mln. litres
State Average 0.74 mln. litres
Nat. Average 0.74 mln. litres
Greenhouse Pollutionper year per person
16.48tonnes
State Average 19.31 tonnes
Nat. Average 20.3 tonnes
Dwelling Types
91%
5%
3%
Most Common Suburb Professions
17% Professio…
15% Technicia…
14% Managers…
12% Labourers…
Nearby schools: murwillumbah south infants school, mt st patrick college, murwillumbah east primary school, murwillumbah community college
Nearby cafes: fish bowl cafe, sugar beat cafe, dabelles cafe, the blue frog
Nearby doctors: king street medical centre-jenkins helen, king street dental practice - dr. evans michael, advanced radiology clinics murwillumbah, snedden d a
Nearby hospitals: queen street medical centre, murwillumbah district hospital, king street medical centre