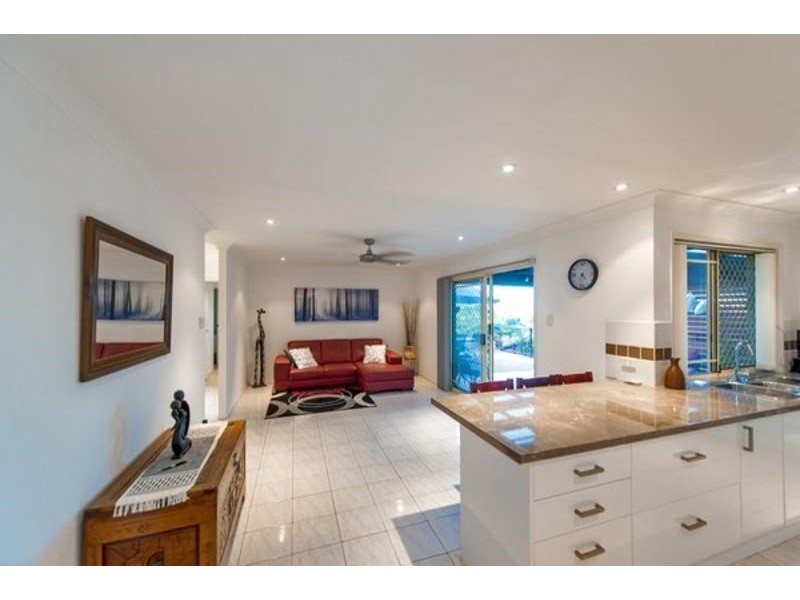
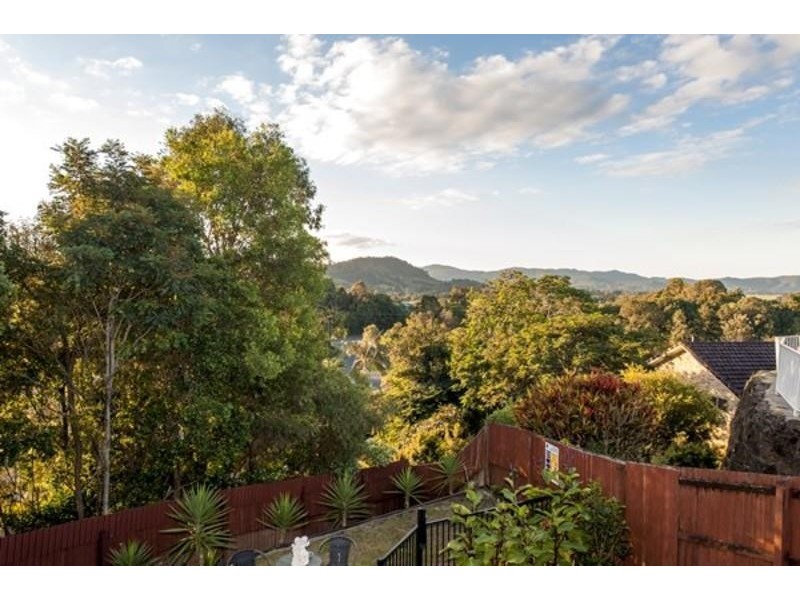
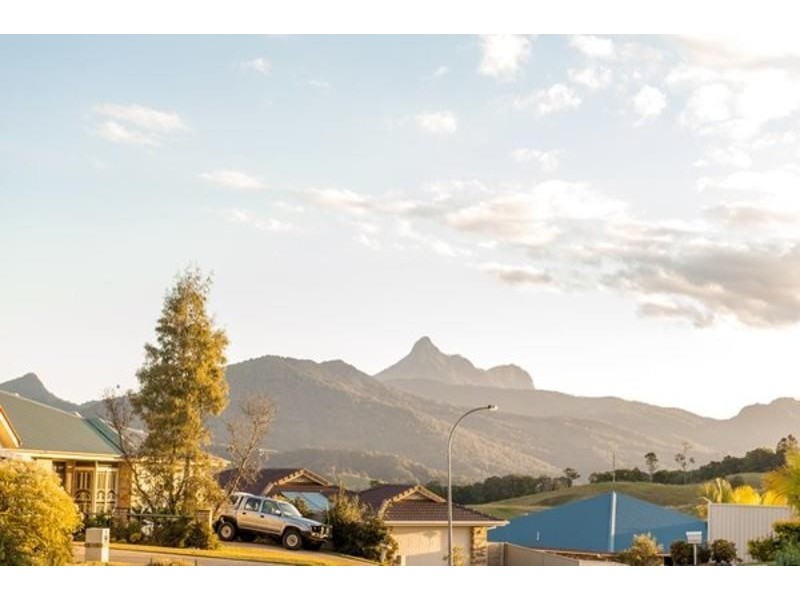
There are approximately 18,049 people living in Murwillumbah but… who are they?
44
49%
51%
Suburb Stats
$834/WK
$250/WK
$382/WK
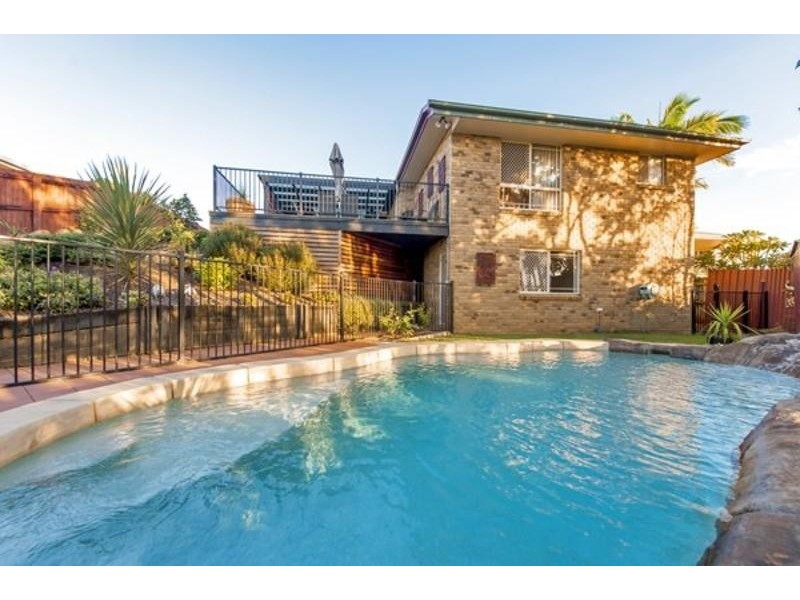
Value of property in Murwillumbah and nearby suburbs
Murwillumbah
Suffolk Park
Nymboida
Bray Park
Average Home Price$479,070Average Rental Price$346Household Size2.5
Average Home Price$937,592Average Rental Price$692Household Size2.3
Average Home Price$315,036Average Rental Price$434Household Size2.4
Average Home Price$494,333Average Rental Price$354Household Size2.5
Water Useper year per person
0.6mln. litres
State Average 0.74 mln. litres
Nat. Average 0.74 mln. litres
Greenhouse Pollutionper year per person
16.48tonnes
State Average 19.31 tonnes
Nat. Average 20.3 tonnes
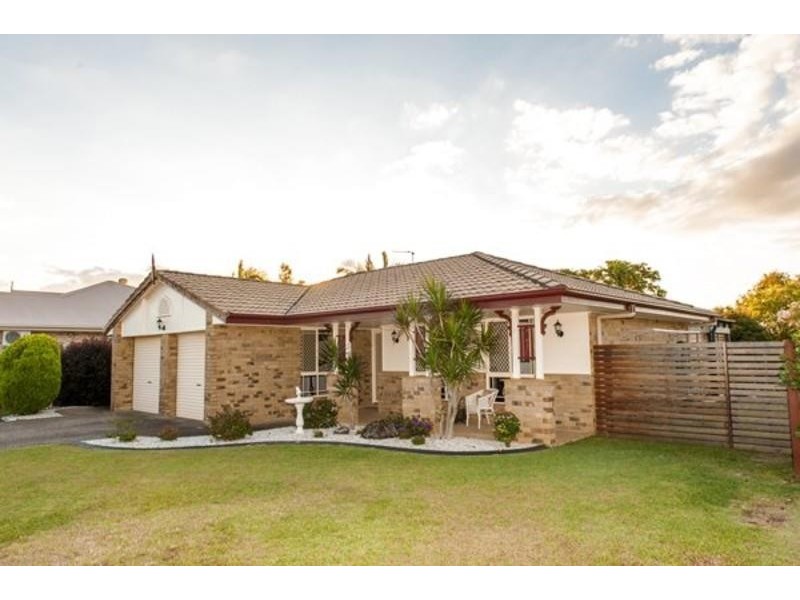
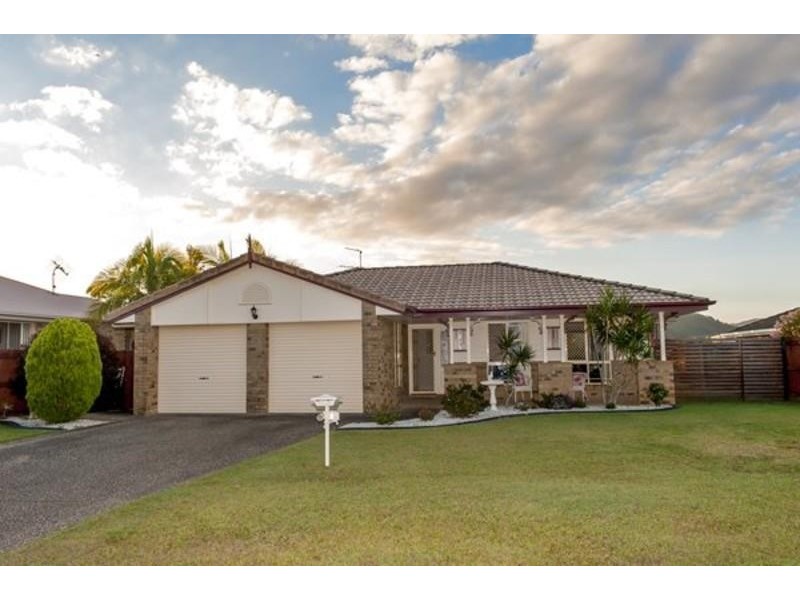
Dwelling Types
91%
5%
3%
Most Common Suburb Professions
17% Professio…
15% Technicia…
14% Managers…
12% Labourers…
Nearby schools: mt st patrick college, murwillumbah high school, murwillumbah south infants school, murwillumbah community college
Nearby cafes: king street cafe, auto cafe, fish bowl cafe, cenzo cafe
Nearby doctors: advanced radiology clinics murwillumbah, qml pathology, king street dental practice - dr. evans michael, king street medical centre-dr yabsley robyn
Nearby hospitals: queen street medical centre, murwillumbah district hospital, king street medical centre