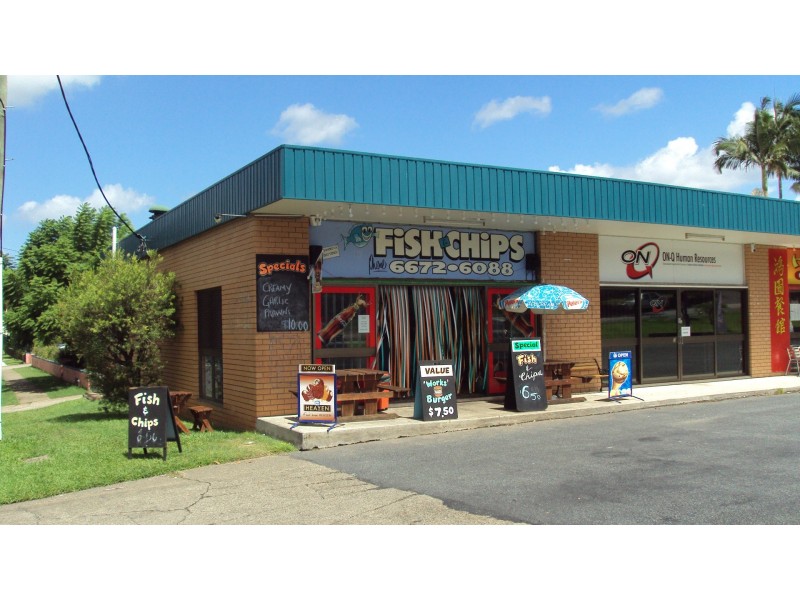
There are approximately 18,049 people living in Murwillumbah but… who are they?
44
49%
51%
Suburb Stats
$834/WK
$250/WK
$382/WK
Value of property in Murwillumbah and nearby suburbs
Murwillumbah
Dungarubba
Stokers Siding
Brushgrove
Average Home Price$479,070Average Rental Price$346Household Size2.5
Average Home Price$490,000Average Rental Price$420Household Size2.4
Average Home Price$768,339Average Rental Price$382Household Size2.5
Average Home Price$460,239Average Rental Price$327Household Size2.4
Water Useper year per person
0.6mln. litres
State Average 0.74 mln. litres
Nat. Average 0.74 mln. litres
Greenhouse Pollutionper year per person
16.48tonnes
State Average 19.31 tonnes
Nat. Average 20.3 tonnes
Dwelling Types
91%
5%
3%
Most Common Suburb Professions
17% Professio…
15% Technicia…
14% Managers…
12% Labourers…
Nearby schools: mt st patrick college, murwillumbah east primary school, murwillumbah community college, murwillumbah south infants school
Nearby cafes: fish bowl cafe, auto cafe, sugar beat cafe, the blue frog
Nearby doctors: king street medical centre-dr yabsley robyn, kettle i h, rightfoot podiatry & footwear clinics, king street medical centre-warne douglas
Nearby hospitals: queen street medical centre, king street medical centre, murwillumbah district hospital