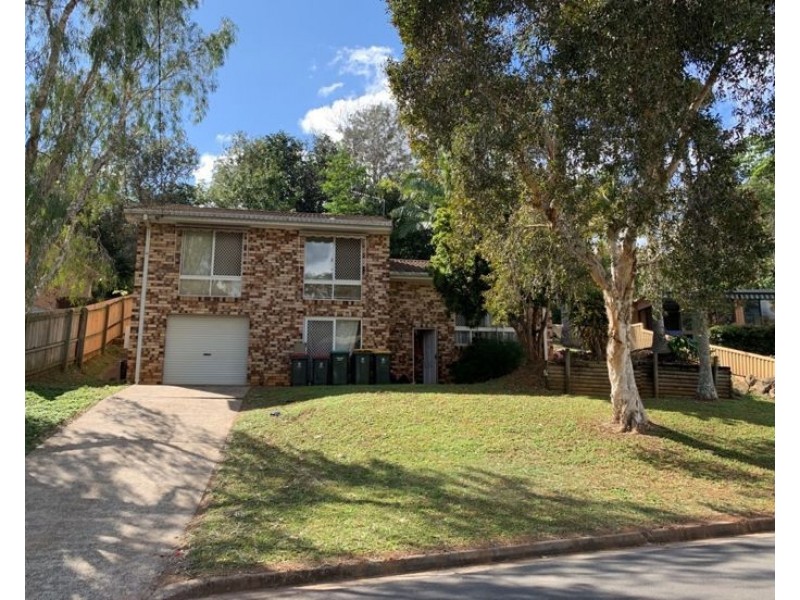
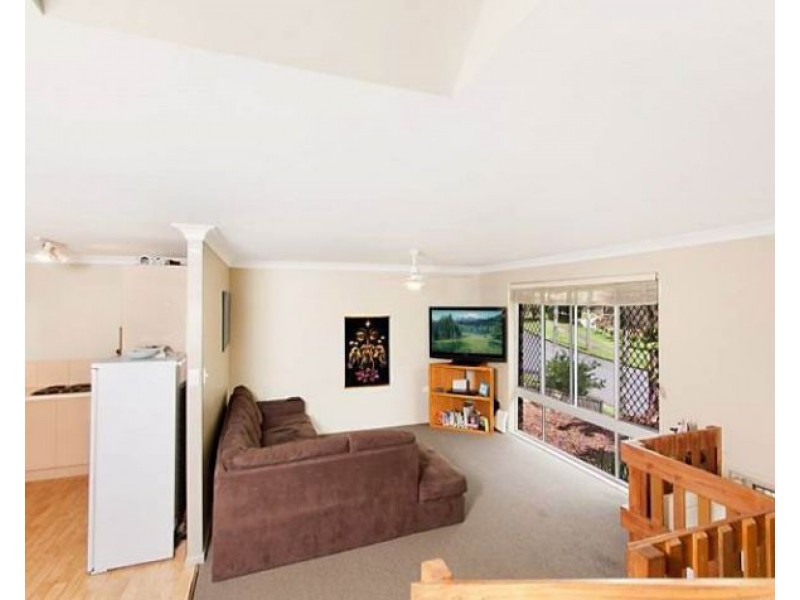
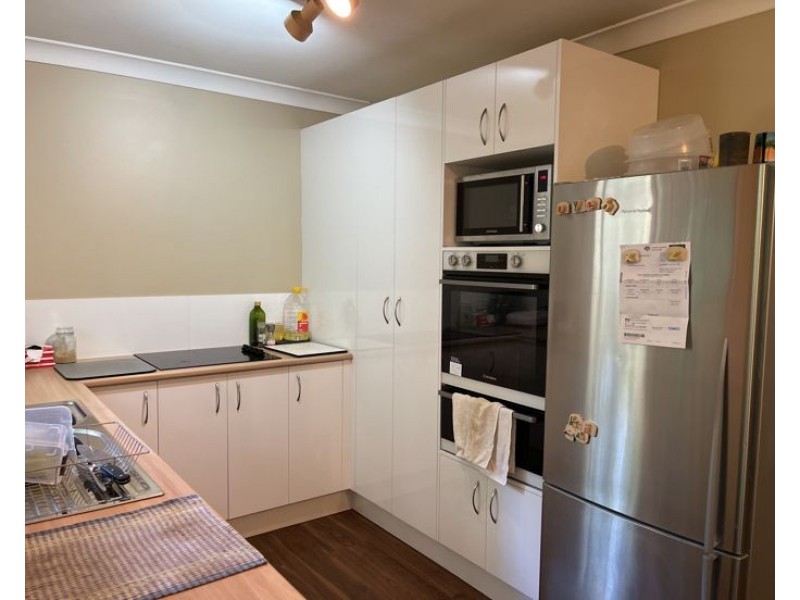
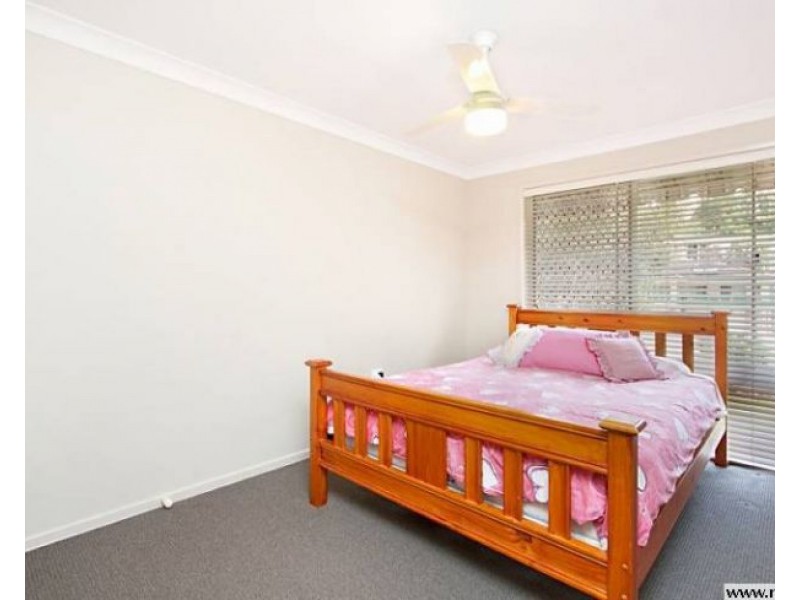
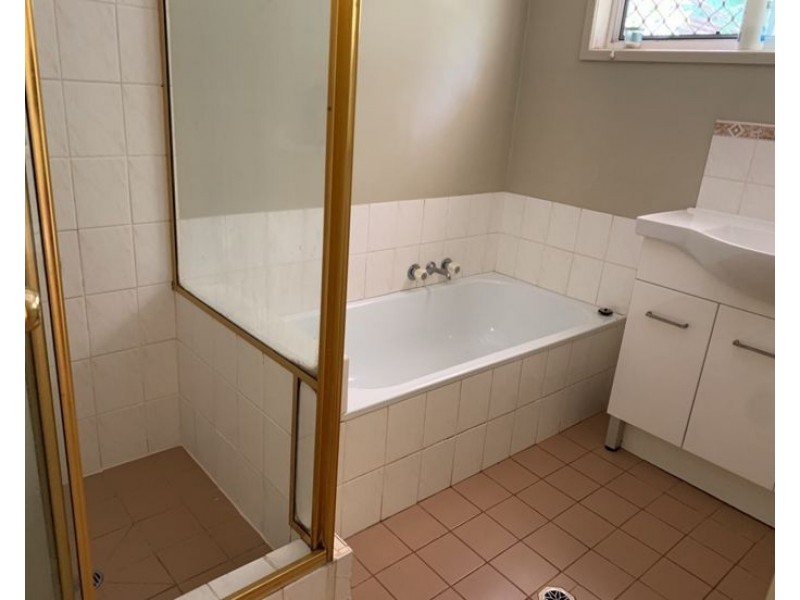
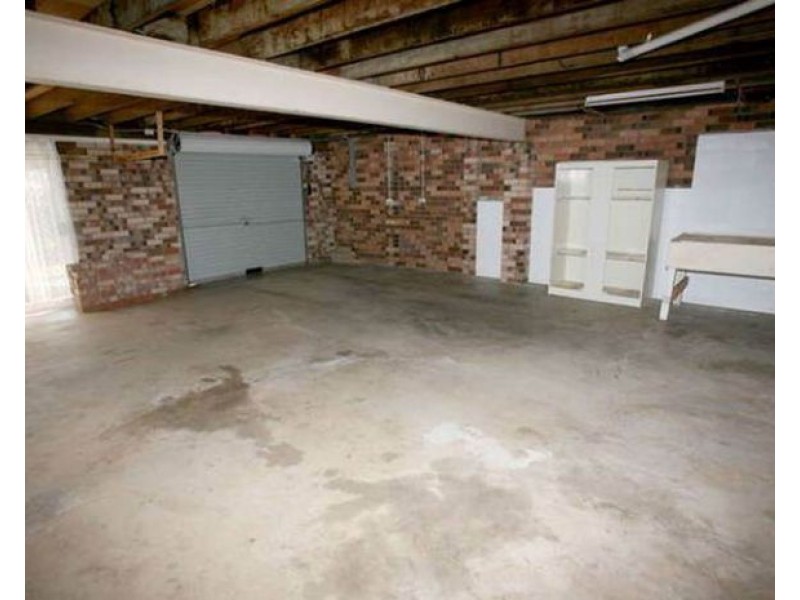
9 Joshua Street, Murwillumbah NSW 2484 Convenient Family Home $550 Weekly 3 1 1 Enquire Listing ID: 23853668 Other properties to rent near 9 Joshua Street, Murwillumbah NSW 2484 151a Murwillumbah Street, Murwillumbah NSW 2484 196 Murwillumbah Street, Murwillumbah NSW 2484 196 Murwillumbah Street, Murwillumbah NSW 2484 2/1 Frances Street, Murwillumbah NSW 2484 66 Castle Field Drive, Murwillumbah NSW 2484 Location Enquire Enquiry about this property Name* Email* Phone* Message* Send me regular newsletters from Homehound Have agents get in touch about similar properties within the area What is 8 + 20?* Receive email alerts for properties like this Email alerts Email* Send me regular newsletters from Homehound. Have agents get in touch about similar properties within the area What is 8 + 20?*