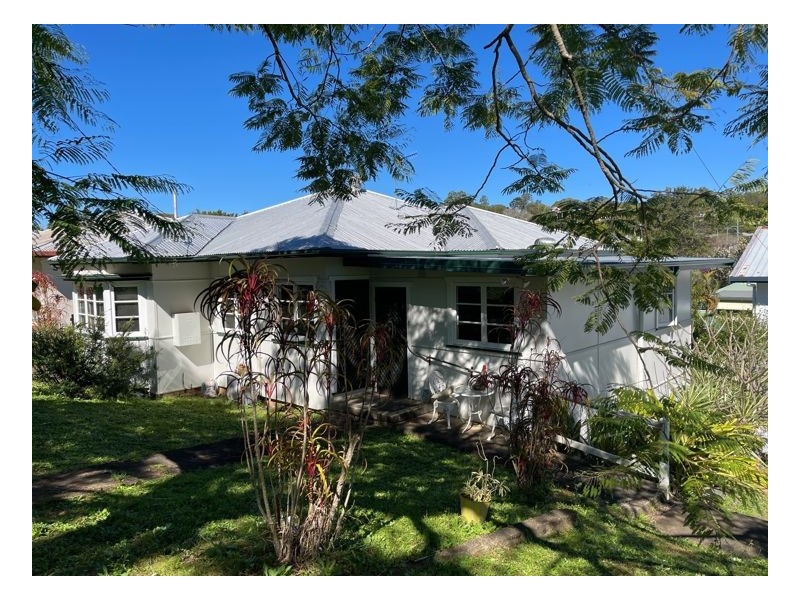
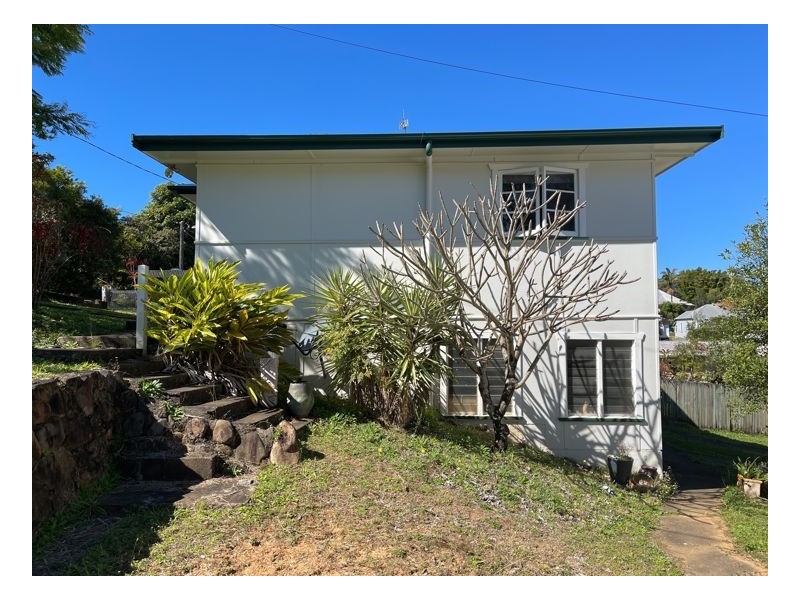
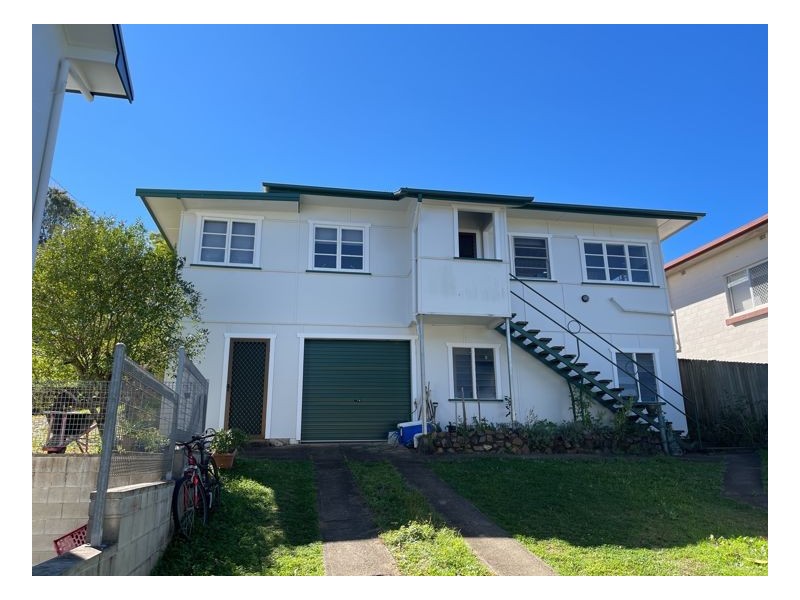
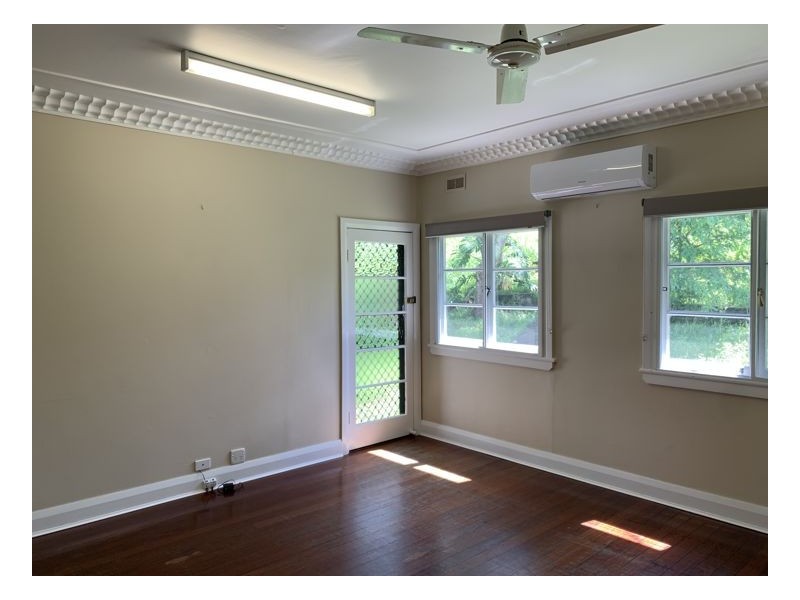
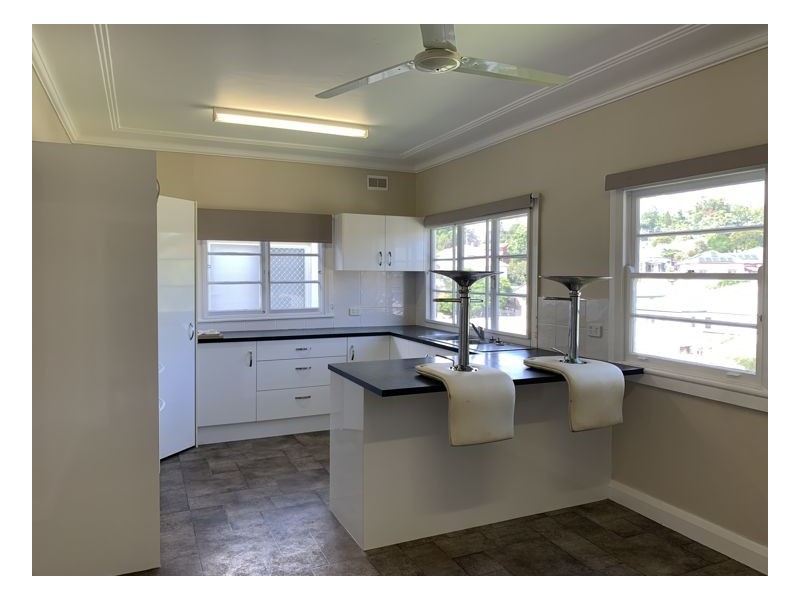
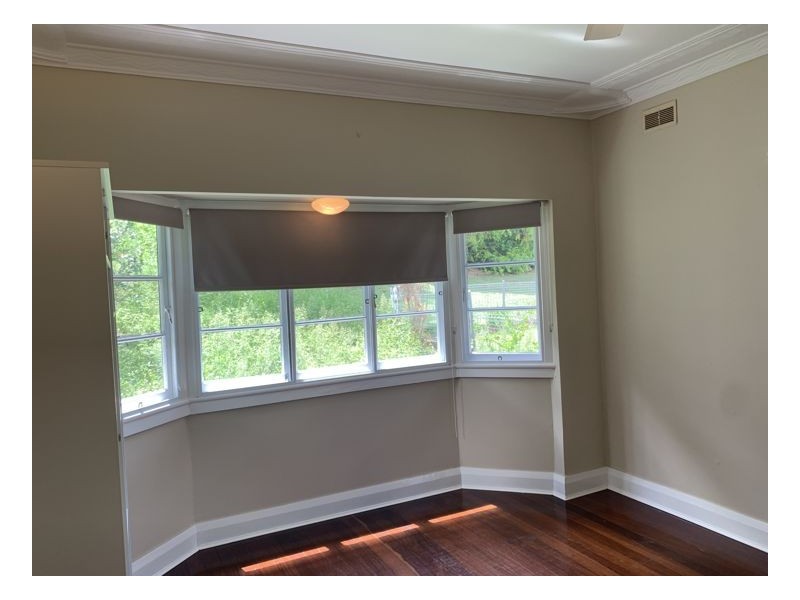
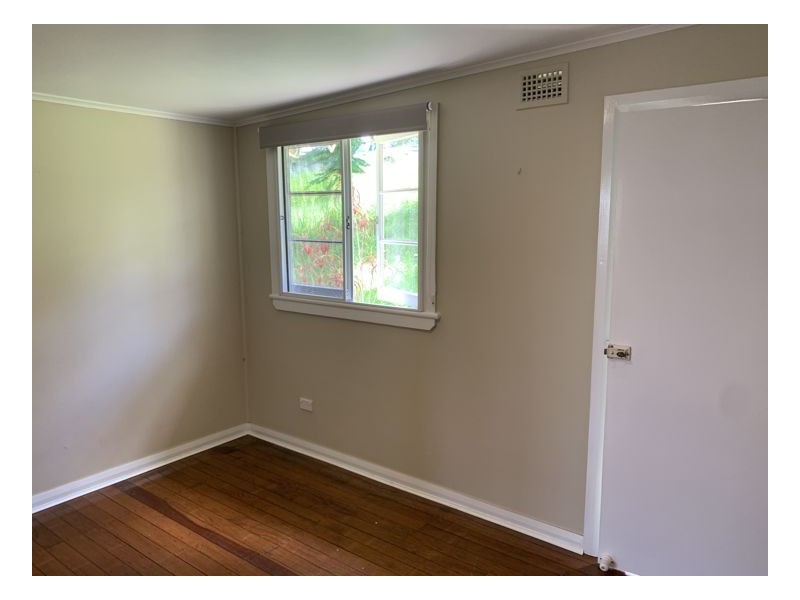
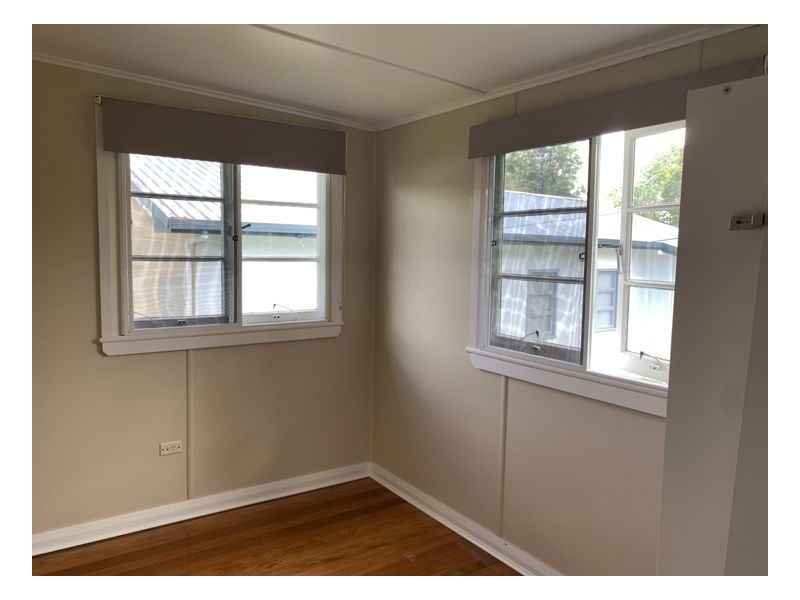
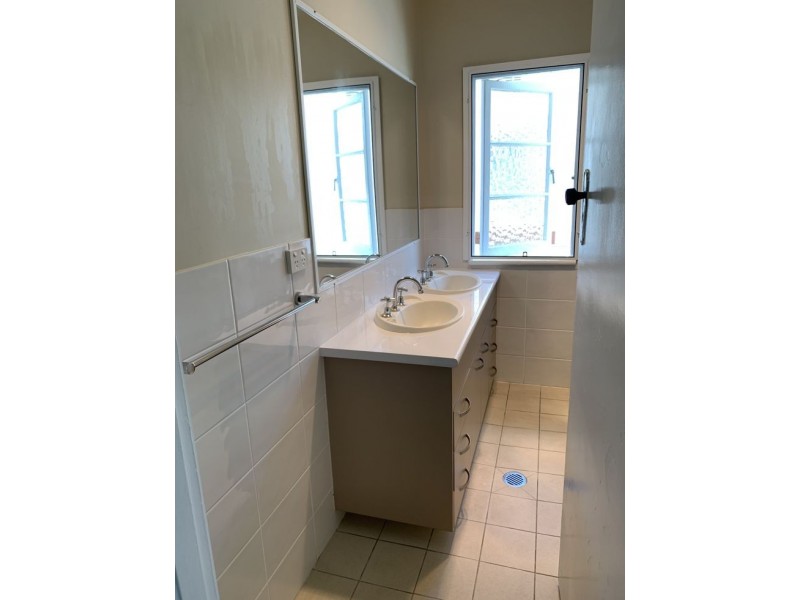
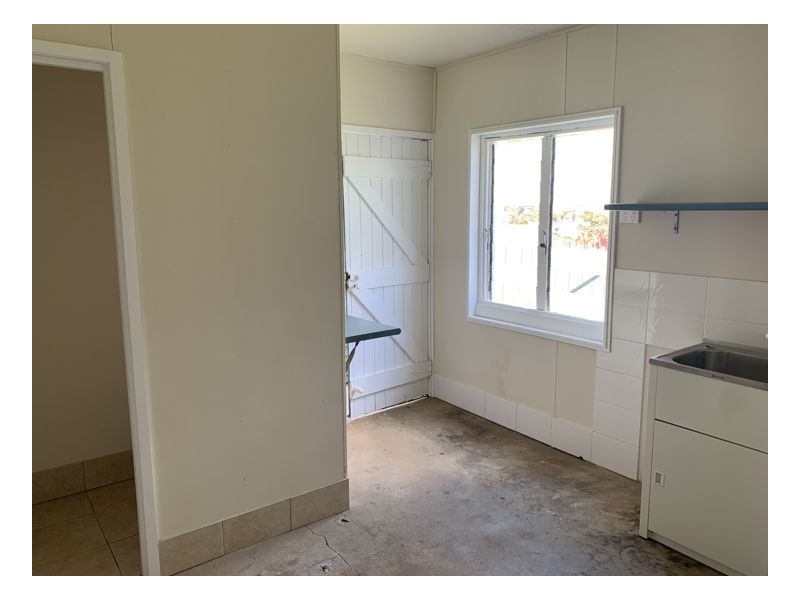
There are approximately 18,049 people living in Murwillumbah but… who are they?
44
49%
51%
Suburb Stats
$834/WK
$250/WK
$382/WK
Value of property in Murwillumbah and nearby suburbs
Murwillumbah
Brushgrove
Woombah
Corindi Beach
Average Home Price$479,070Average Rental Price$346Household Size2.5
Average Home Price$460,239Average Rental Price$327Household Size2.4
Average Home Price$439,199Average Rental Price$357Household Size2.4
Average Home Price$520,293Average Rental Price$395Household Size2.5
Water Useper year per person
0.6mln. litres
State Average 0.74 mln. litres
Nat. Average 0.74 mln. litres
Greenhouse Pollutionper year per person
16.48tonnes
State Average 19.31 tonnes
Nat. Average 20.3 tonnes
Dwelling Types
91%
5%
3%
Most Common Suburb Professions
17% Professio…
15% Technicia…
14% Managers…
12% Labourers…
Nearby schools: mt st patrick college, murwillumbah east primary school, murwillumbah high school, murwillumbah community college
Nearby cafes: the modern grocer, king street cafe, cenzo cafe, fish bowl cafe
Nearby doctors: king street medical centre-dr john moran, main street medical centre, rightfoot podiatry & footwear clinics, king street dental practice - dr. evans michael
Nearby hospitals: murwillumbah district hospital, queen street medical centre, king street medical centre