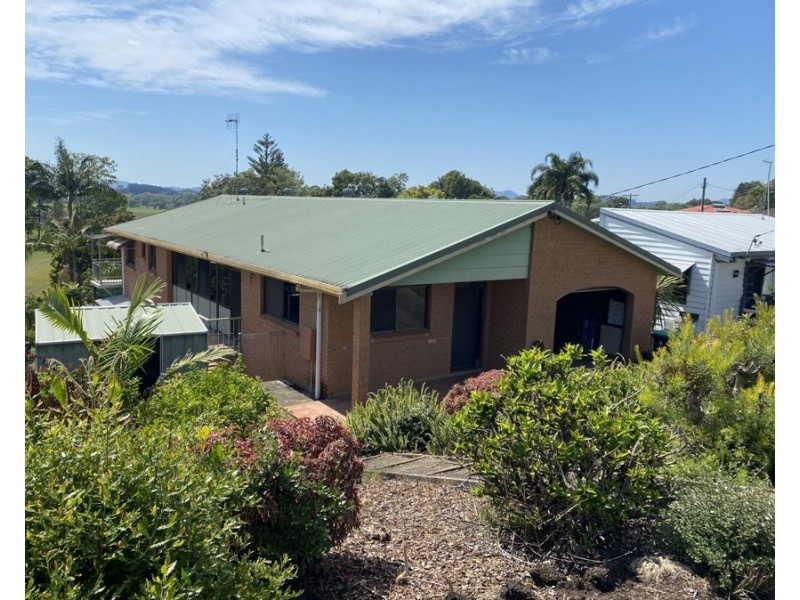
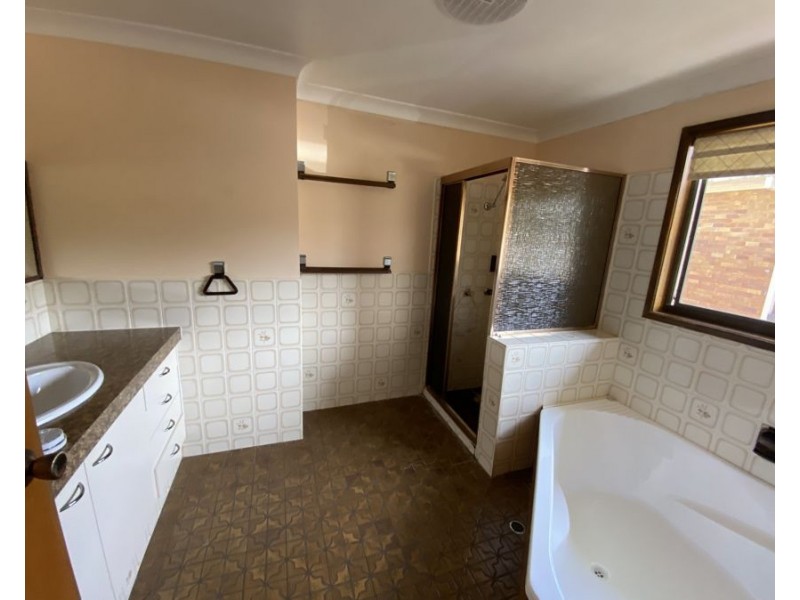
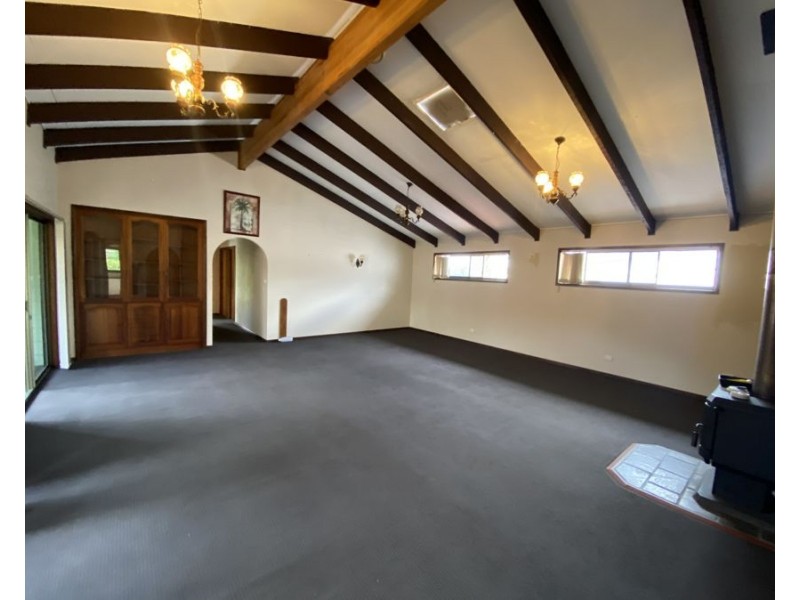
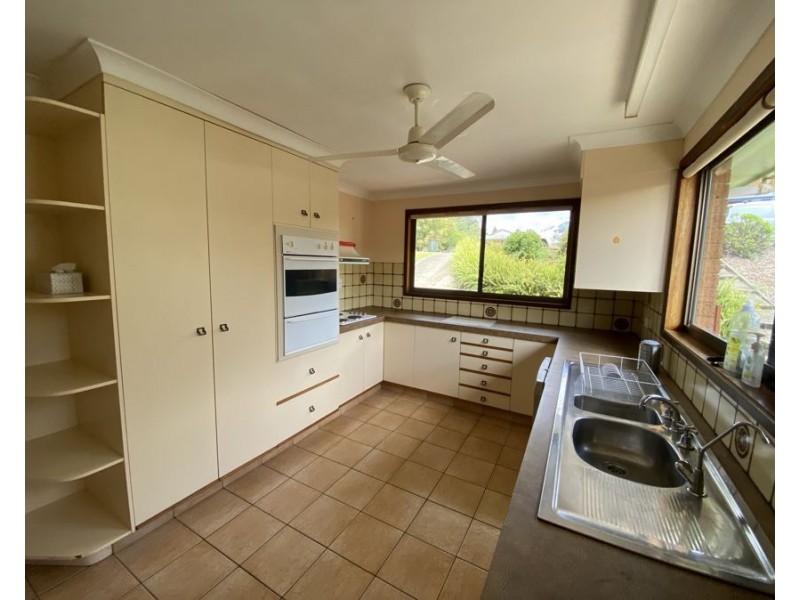
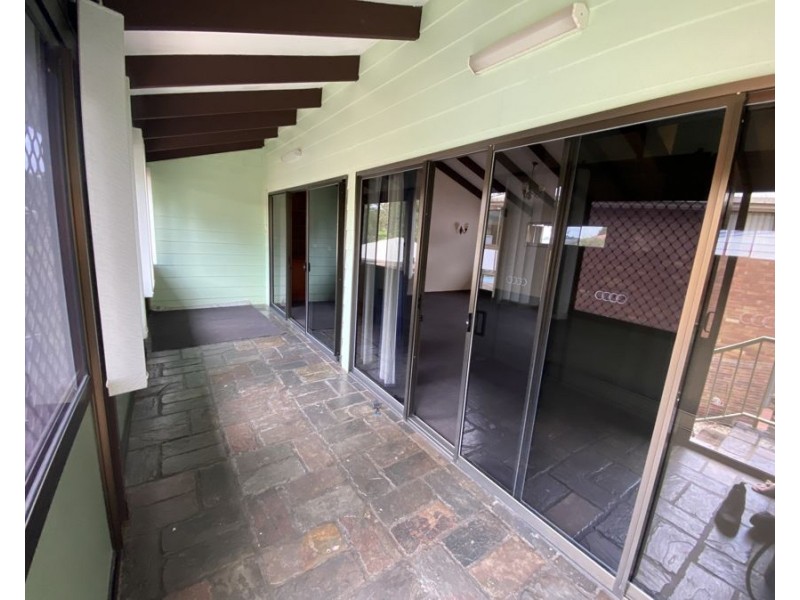
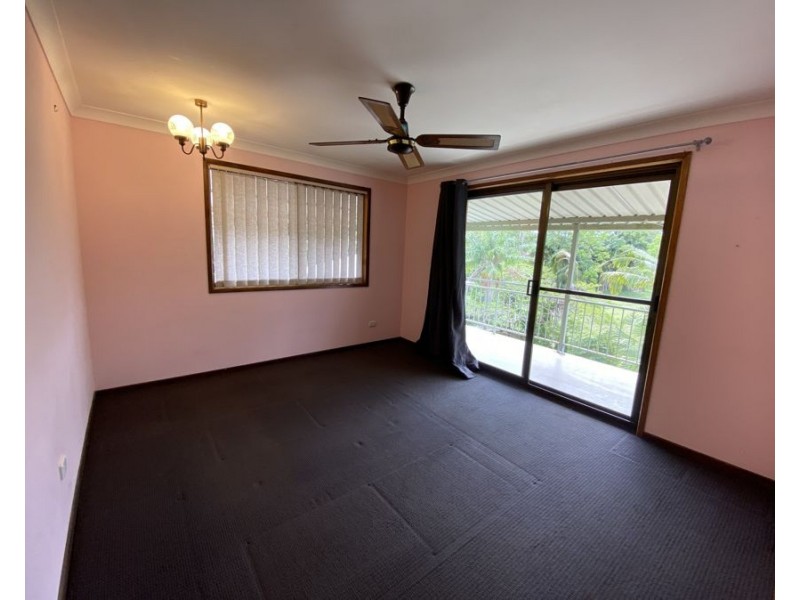
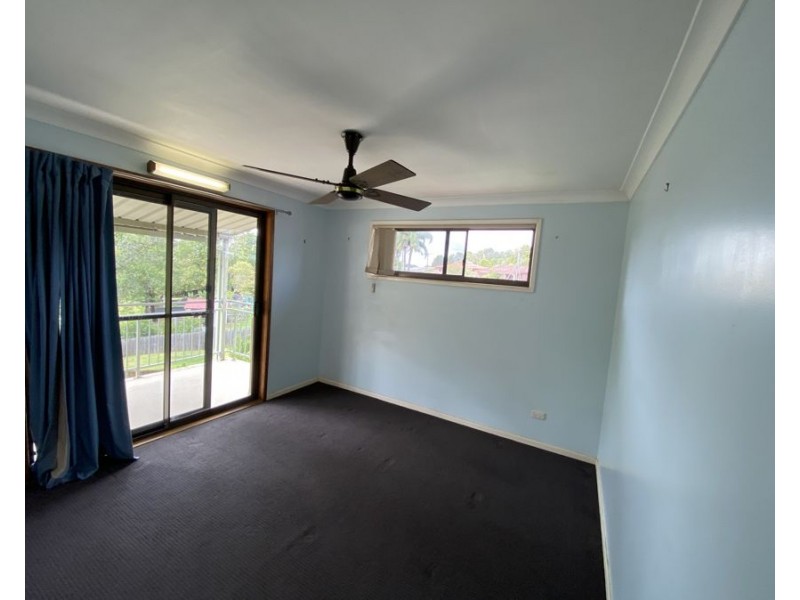
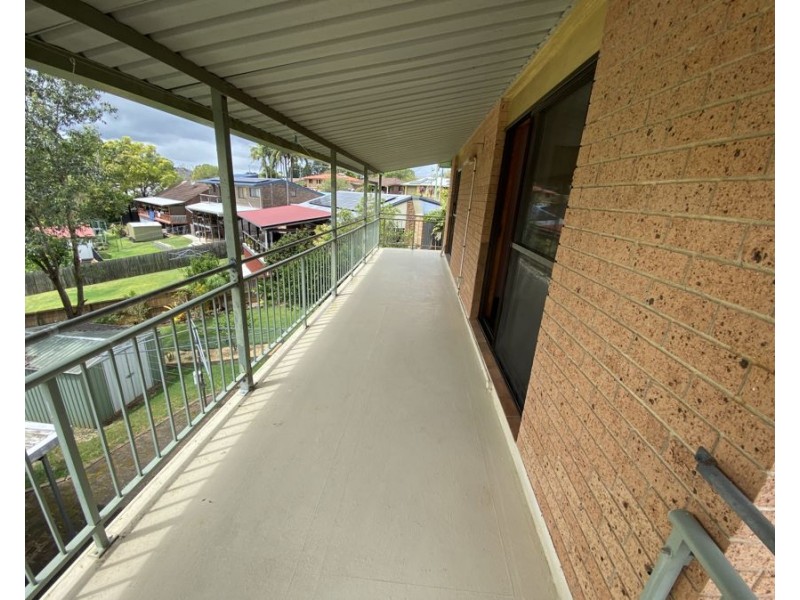
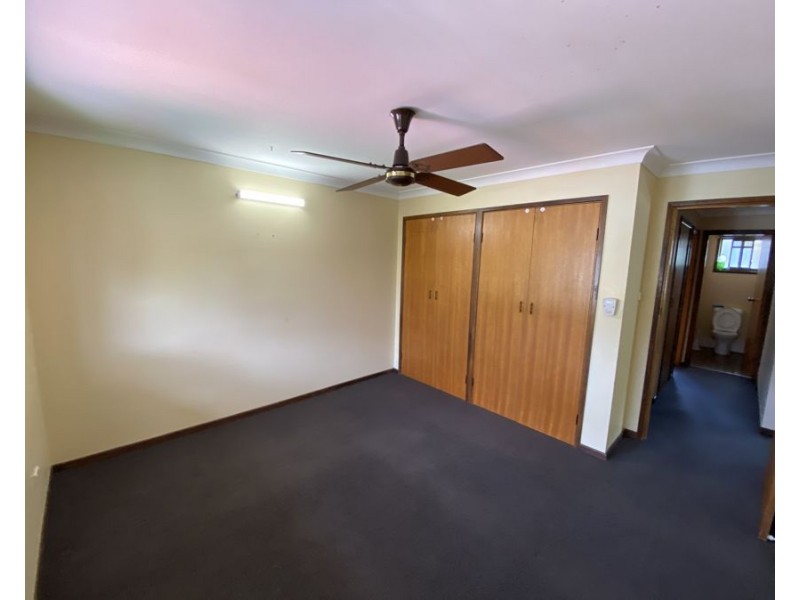
There are approximately 18,049 people living in Murwillumbah but… who are they?
44
49%
51%
Suburb Stats
$834/WK
$250/WK
$382/WK
Value of property in Murwillumbah and nearby suburbs
Murwillumbah
Sandy Beach
South Grafton
Patchs Beach
Average Home Price$479,070Average Rental Price$346Household Size2.5
Average Home Price$456,850Average Rental Price$354Household Size2.5
Average Home Price$271,720Average Rental Price$291Household Size2.4
Average Home Price$614,500Average Rental Price$465Household Size2.3
Water Useper year per person
0.6mln. litres
State Average 0.74 mln. litres
Nat. Average 0.74 mln. litres
Greenhouse Pollutionper year per person
16.48tonnes
State Average 19.31 tonnes
Nat. Average 20.3 tonnes
Dwelling Types
91%
5%
3%
Most Common Suburb Professions
17% Professio…
15% Technicia…
14% Managers…
12% Labourers…
Nearby schools: murwillumbah community college, murwillumbah east primary school, mt st patrick college, murwillumbah south infants school
Nearby cafes: fish bowl cafe, auto cafe, the modern grocer, dabelles cafe
Nearby doctors: advanced radiology clinics murwillumbah, king street medical centre-warne douglas, king street medical centre-jenkins helen, snedden d a
Nearby hospitals: murwillumbah district hospital, king street medical centre, queen street medical centre