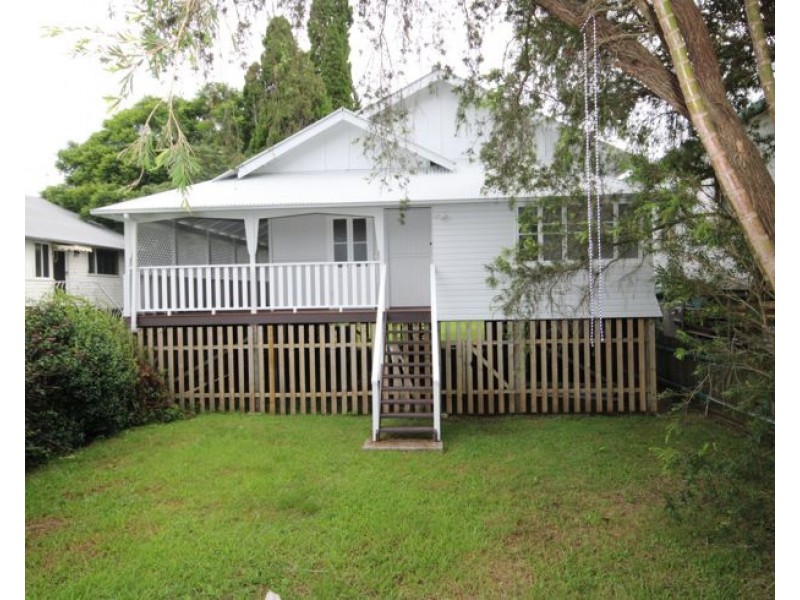
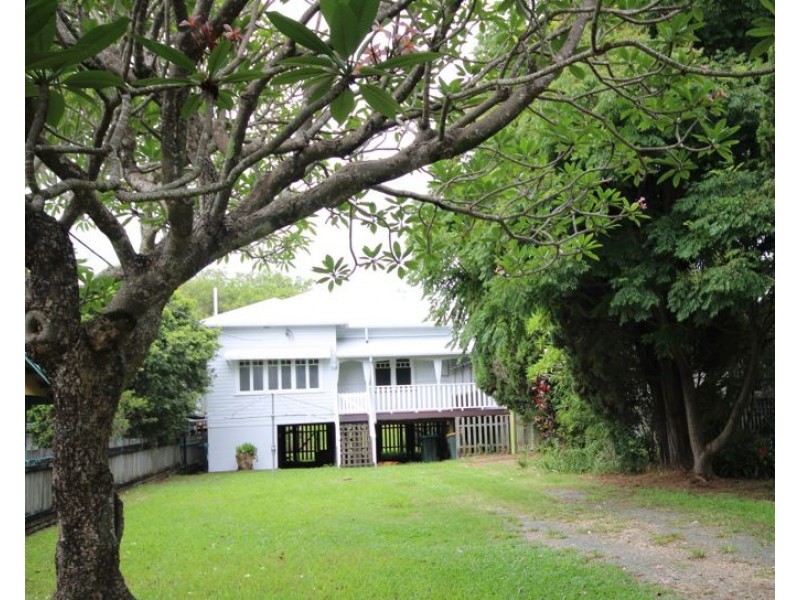
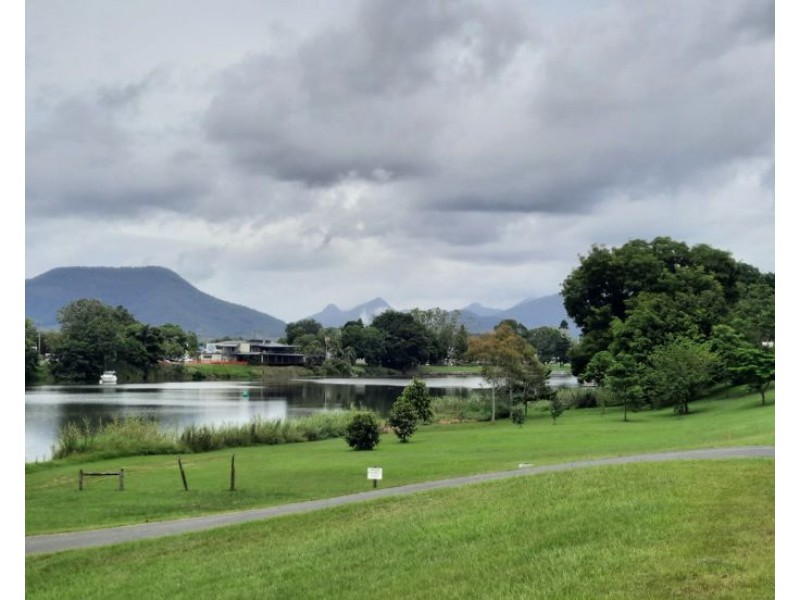
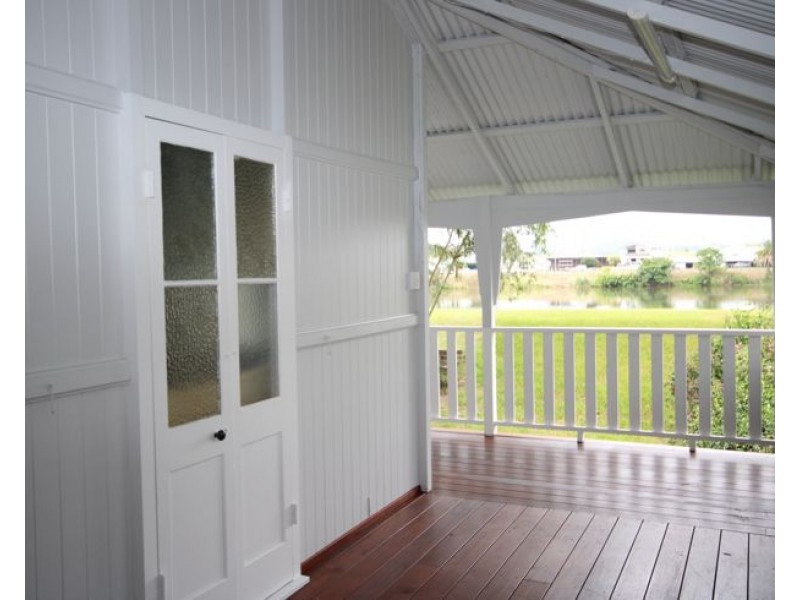
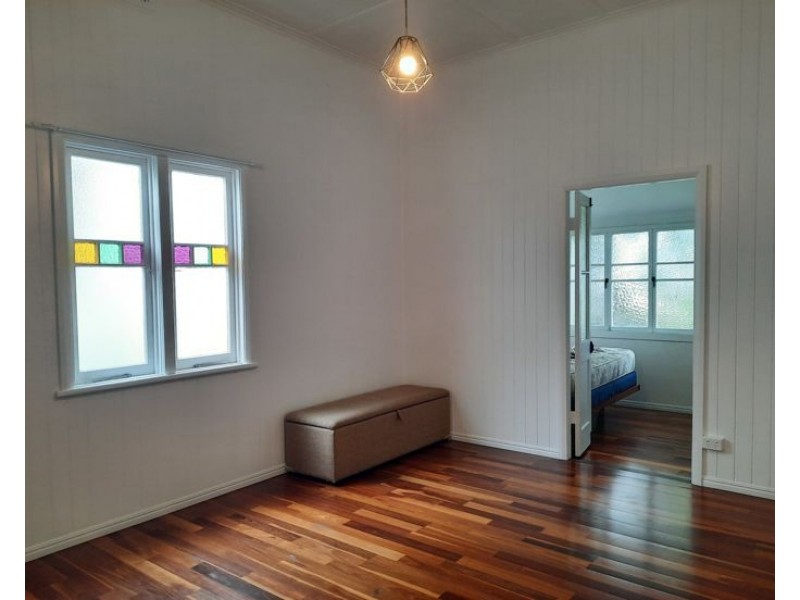
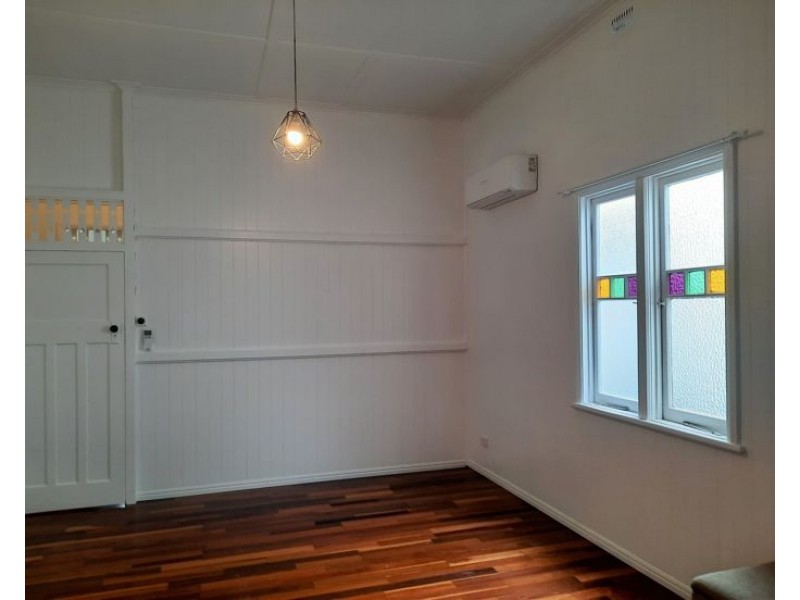
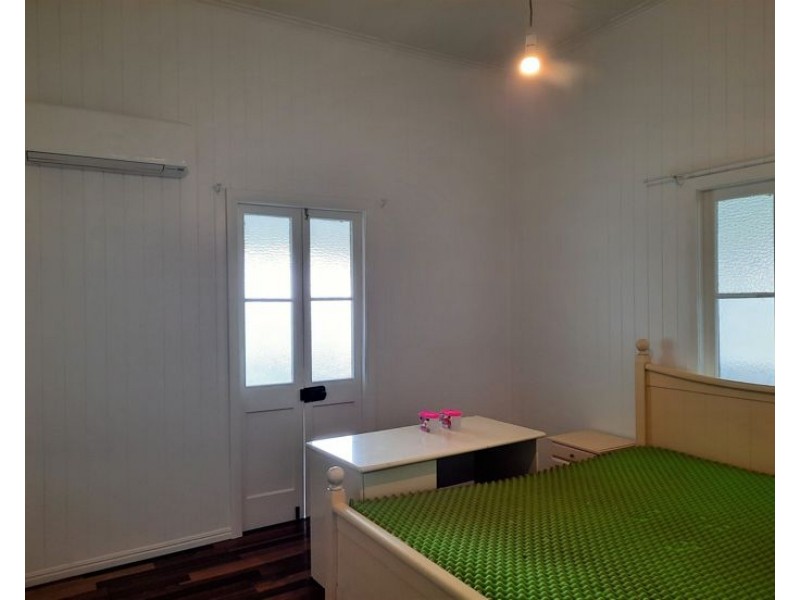
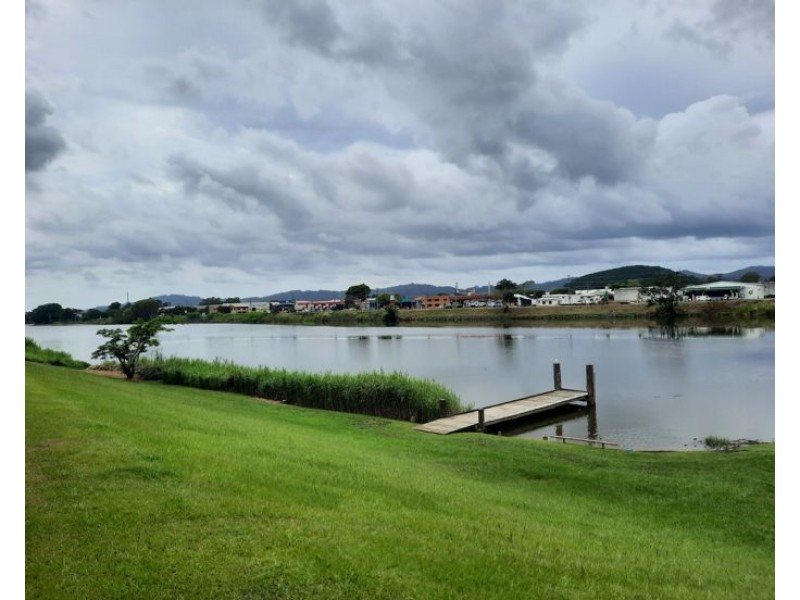
37 Tumbulgum Road, Murwillumbah NSW 2484 River Frontage Charmer Deposit Received Listing history: 21 Feb, 2023 2 1 1 Enquire Listing ID: 41369753 Other properties to rent near 37 Tumbulgum Road, Murwillumbah NSW 2484 94 Tumbulgum Road, Murwillumbah NSW 2484 597 Tumbulgum Road, Murwillumbah NSW 2484 1/9 Tumbulgum Road, Murwillumbah NSW 2484 80 Tumbulgum Road, Murwillumbah NSW 2484 Location Enquire Enquiry about this property Name* Email* Phone* Message* Send me regular newsletters from Homehound Have agents get in touch about similar properties within the area What is 8 + 20?* Receive email alerts for properties like this Email alerts Email* Send me regular newsletters from Homehound. Have agents get in touch about similar properties within the area What is 8 + 20?*