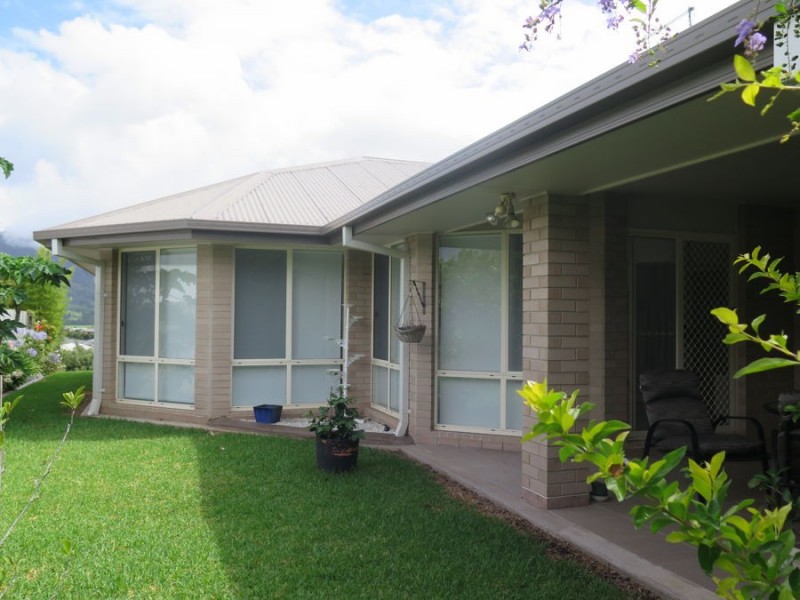
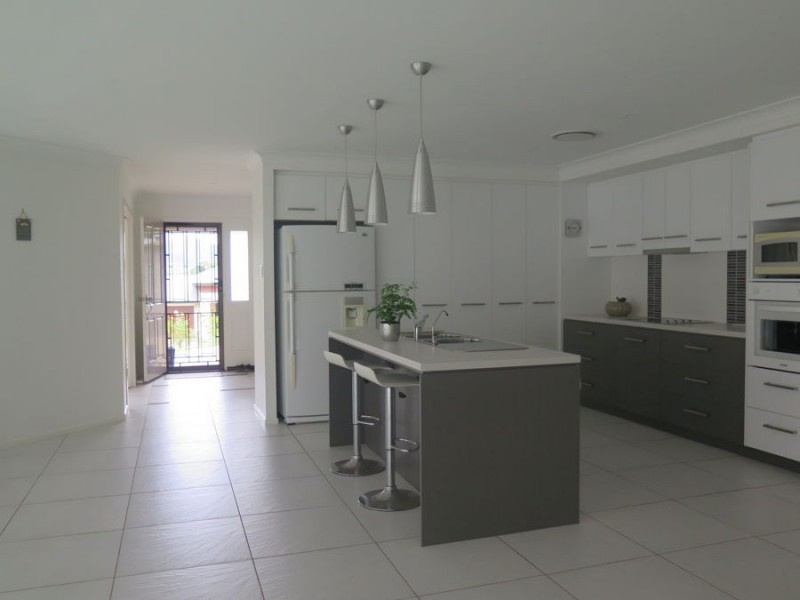
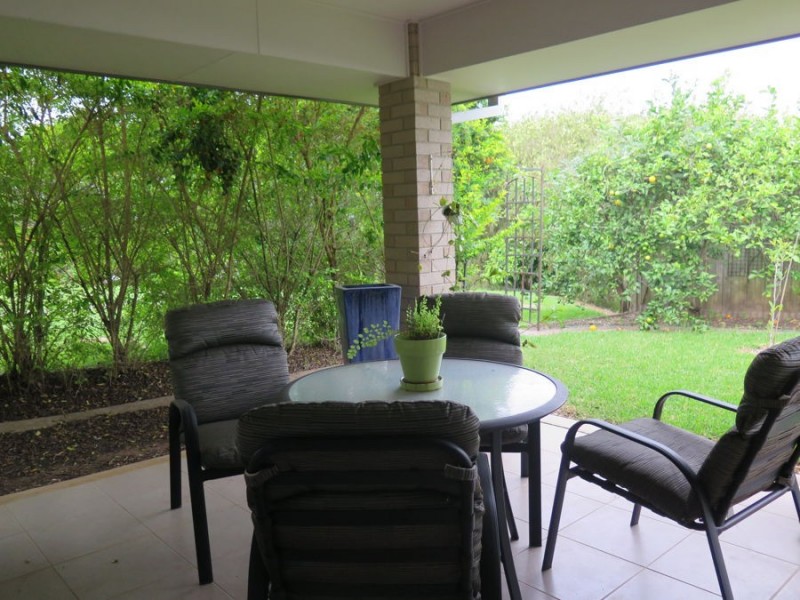
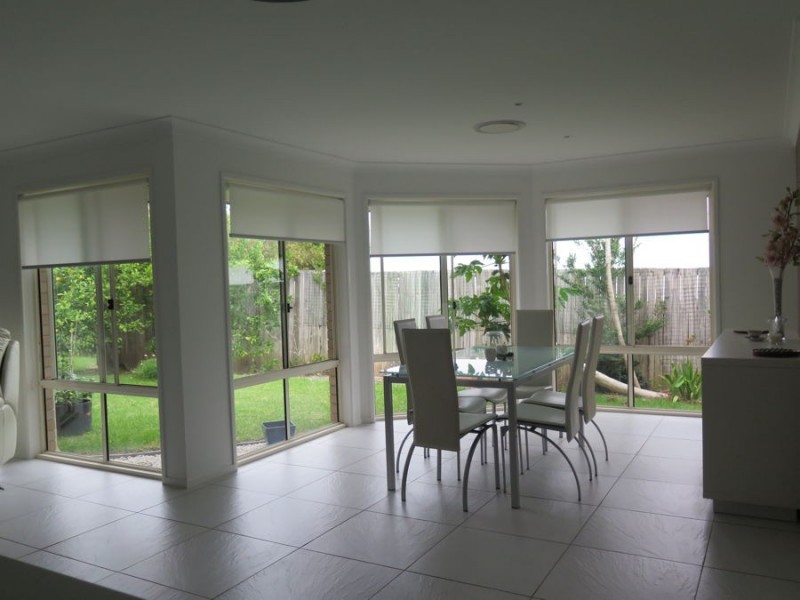
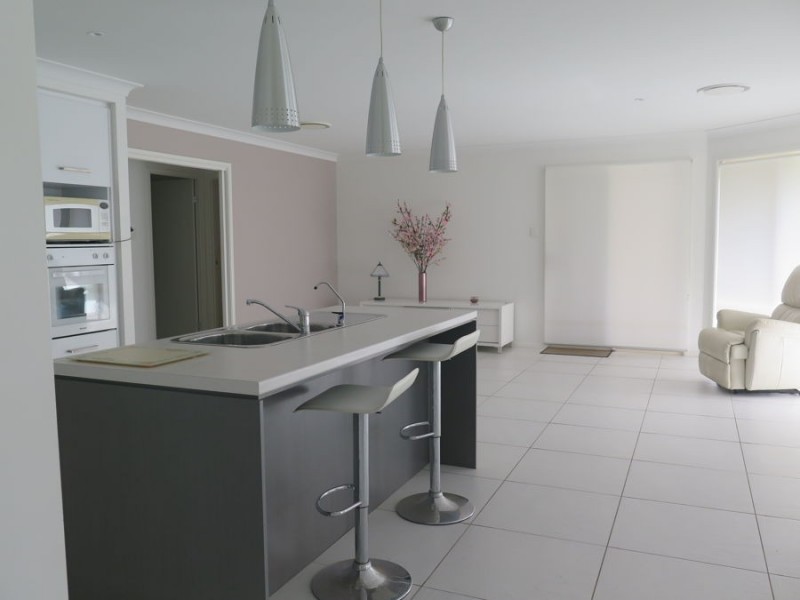
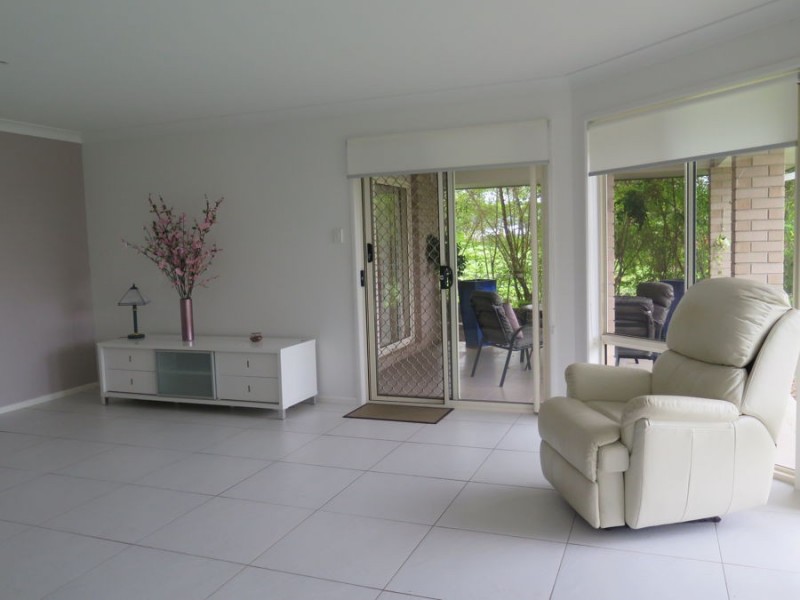
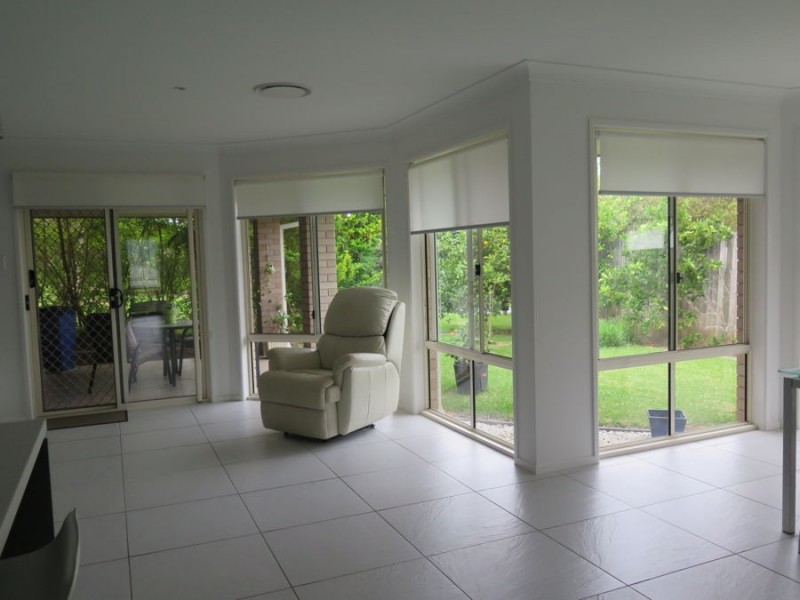
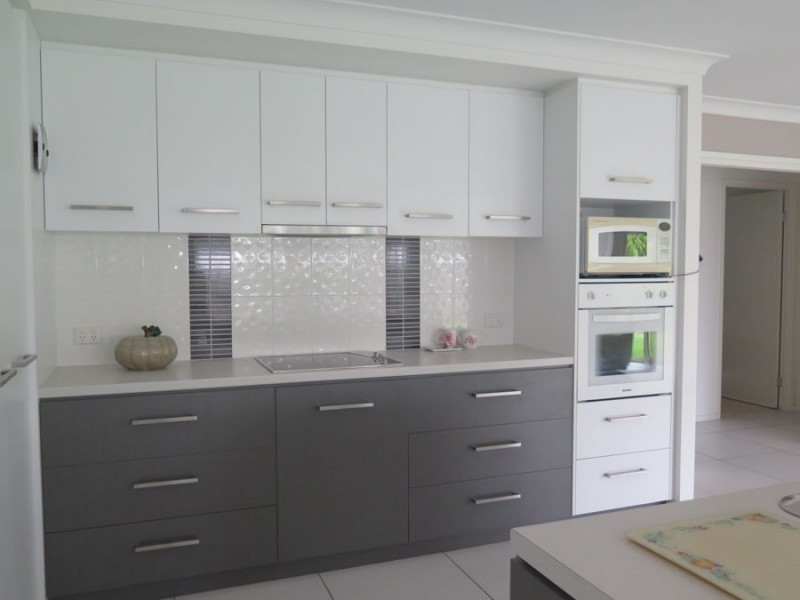
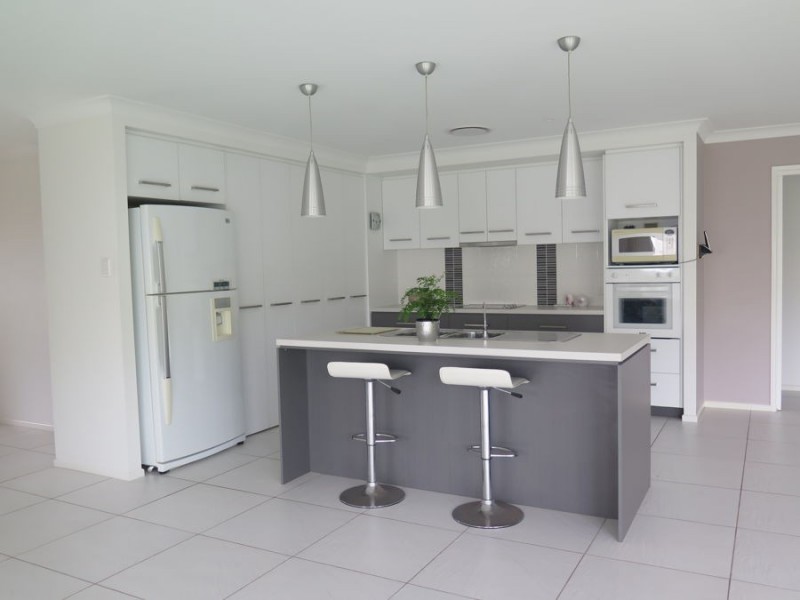
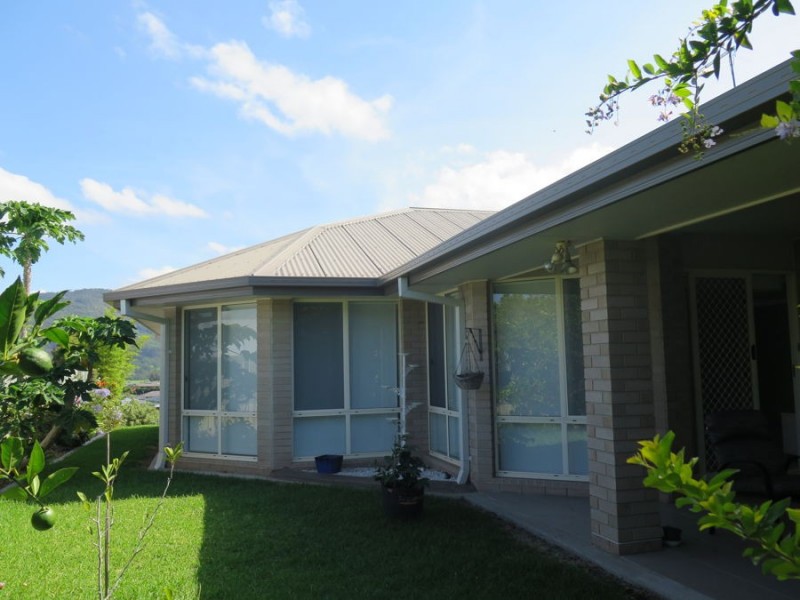
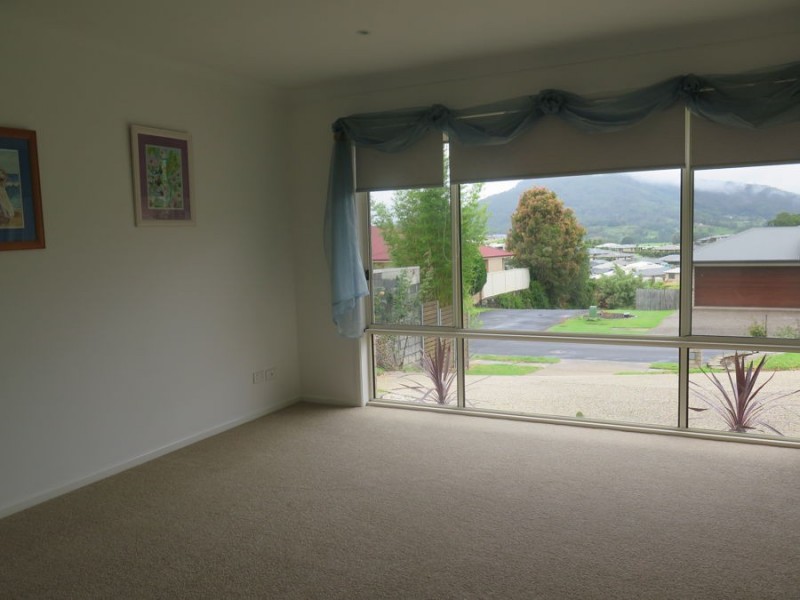
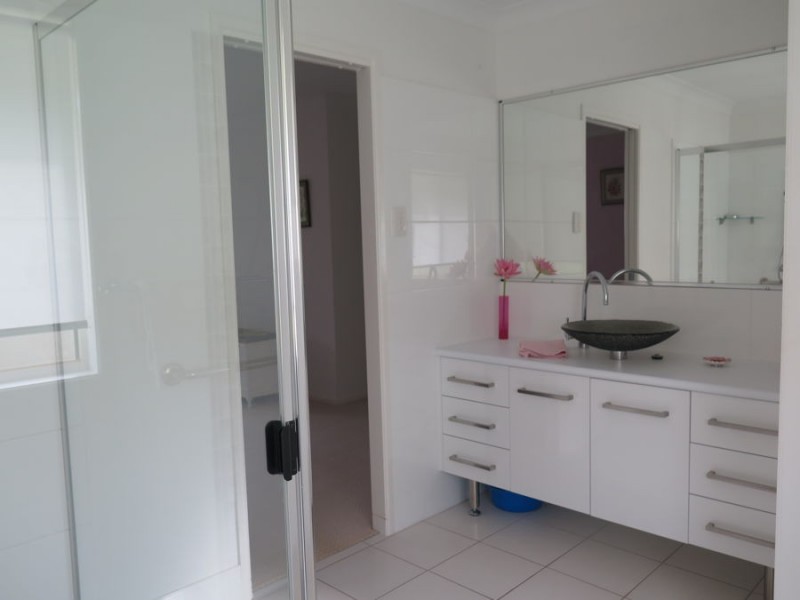
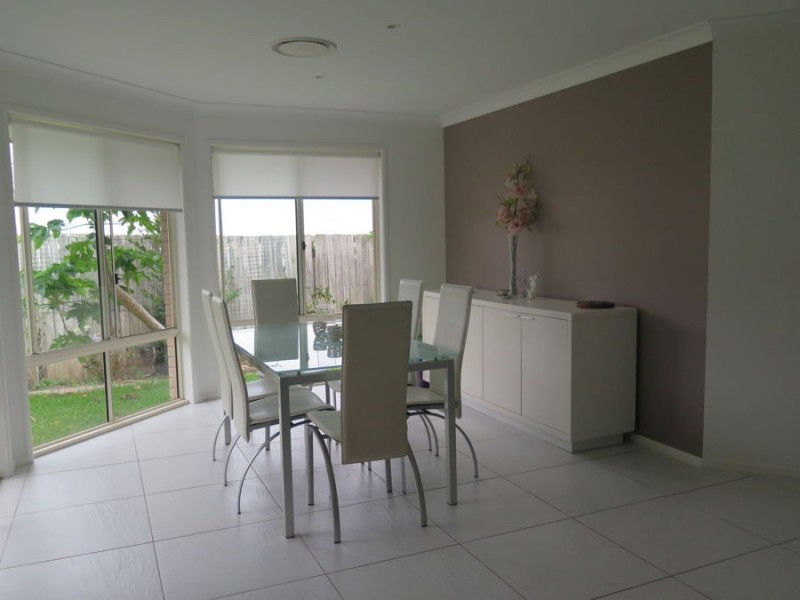
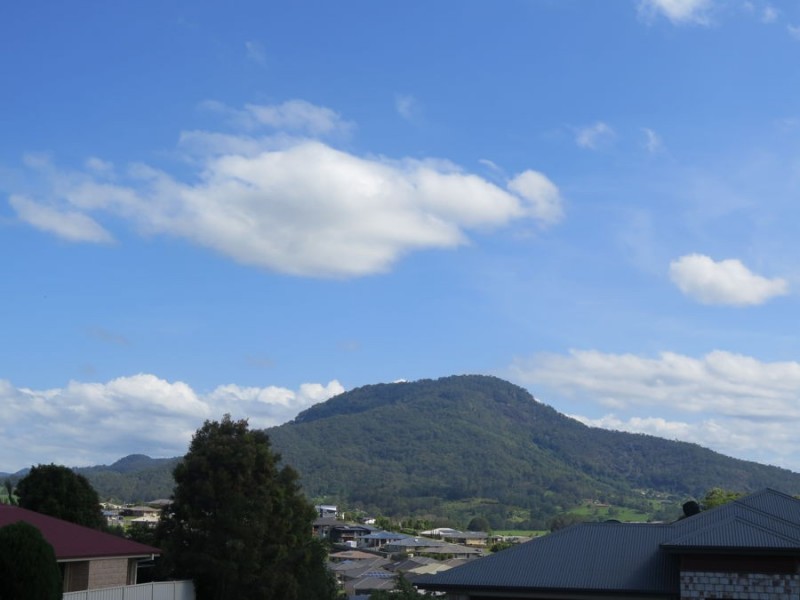
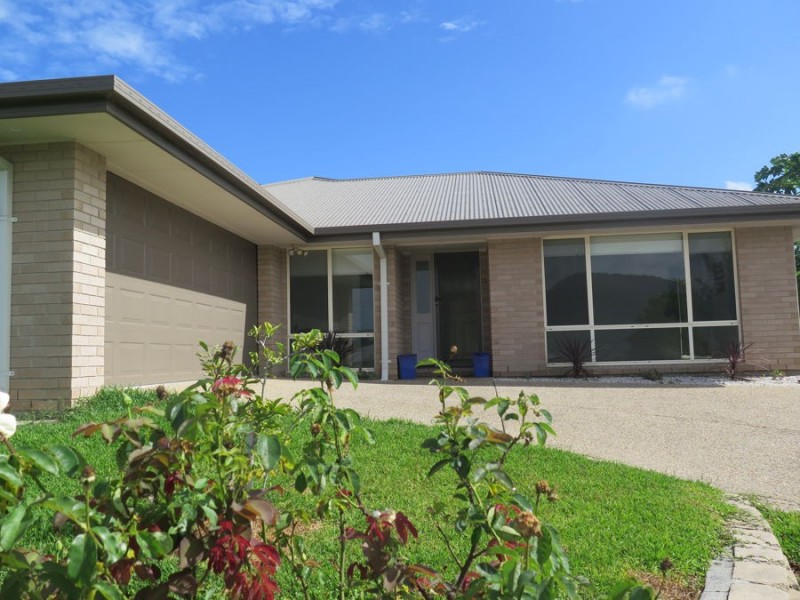
27 Castlefield Drive, Murwillumbah NSW 2484 Perfect For The Family $515,000 4 2 4 Listing ID: 30305973 Other properties for sale near 27 Castlefield Drive, Murwillumbah NSW 2484 5 Tulipwood Court, Murwillumbah NSW 2484 26 Point Lookout Chase, Murwillumbah NSW 2484 51 Ewing Street, Murwillumbah NSW 2484 59 Ewing Street, Murwillumbah NSW 2484 37 William Street, Murwillumbah NSW 2484 Location THIS PROPERTY WAS SOLD Enquiry about this property Name* Email* Phone* Message* Send me regular newsletters from Homehound Have agents get in touch about similar properties within the area What is 8 + 20?* Receive email alerts for properties like this Email alerts Email* Send me regular newsletters from Homehound. Have agents get in touch about similar properties within the area What is 8 + 20?*