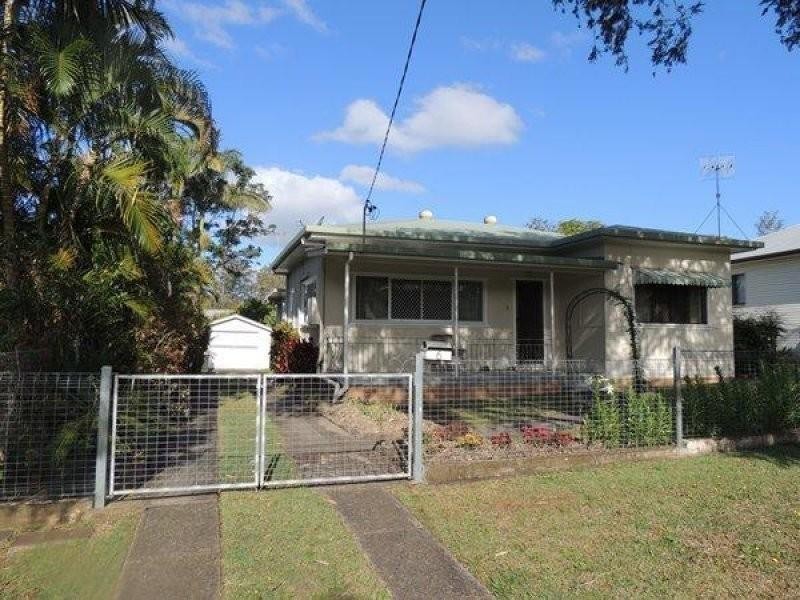
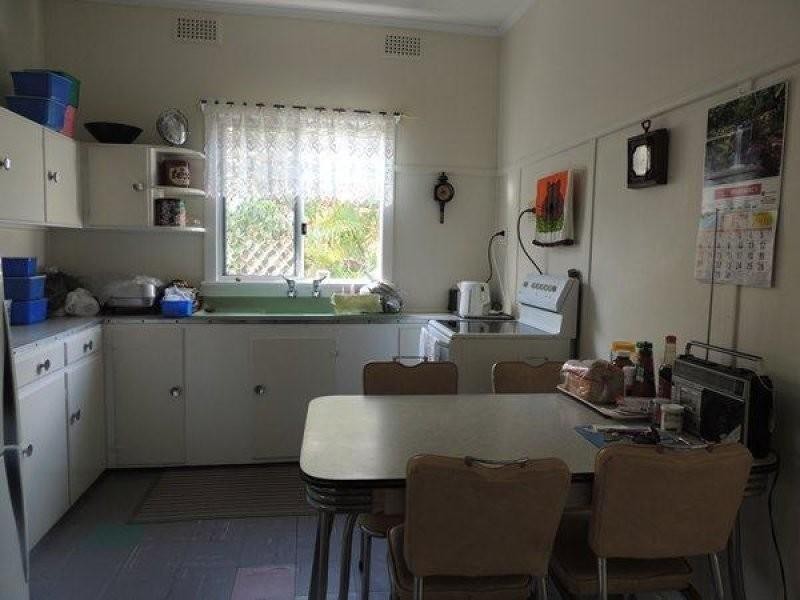
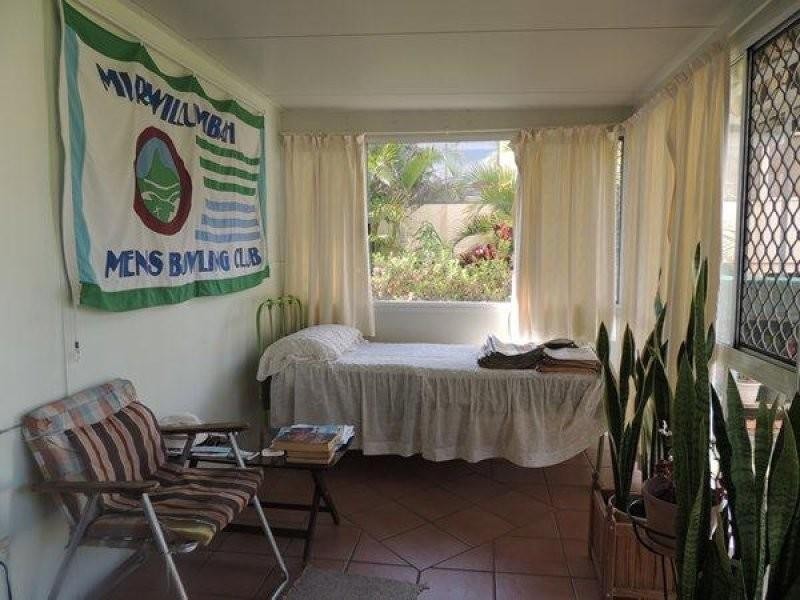
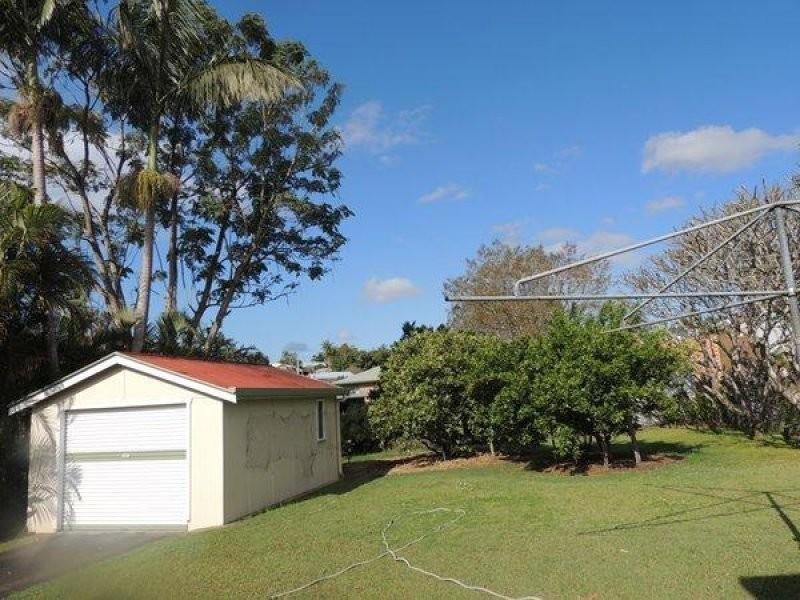
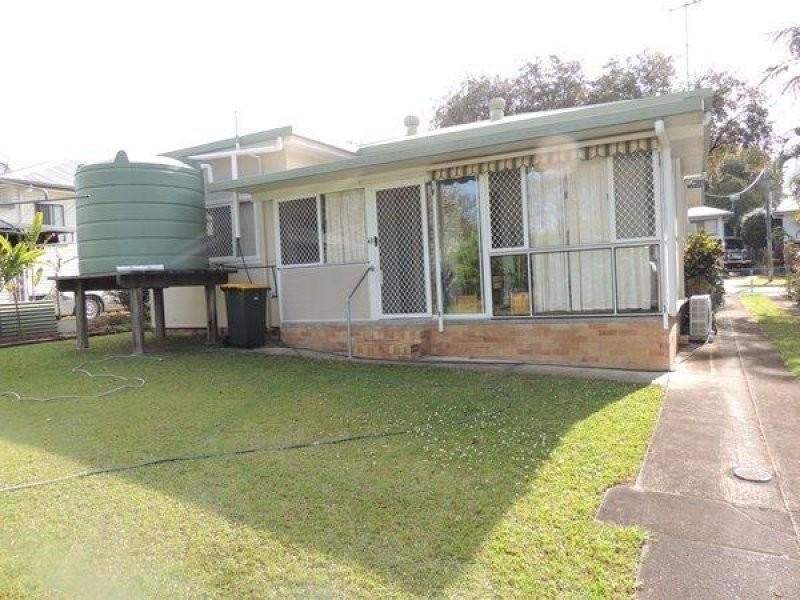
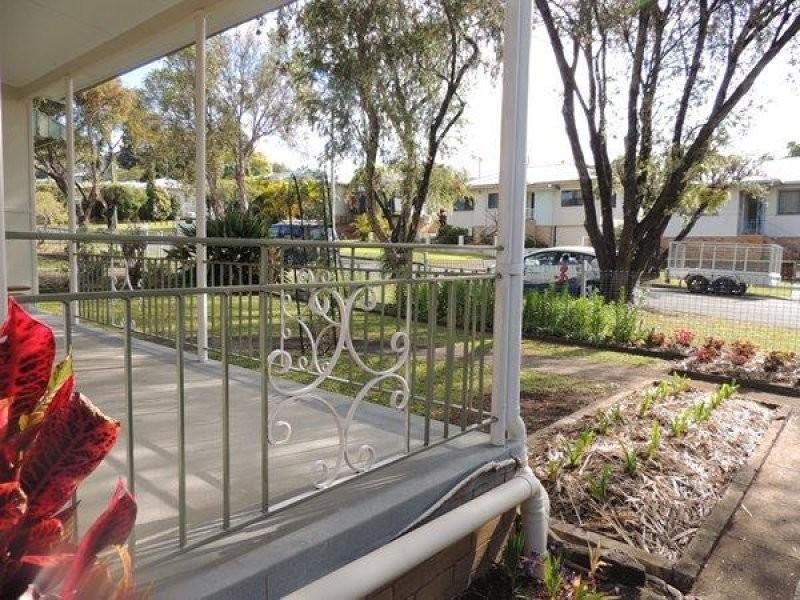
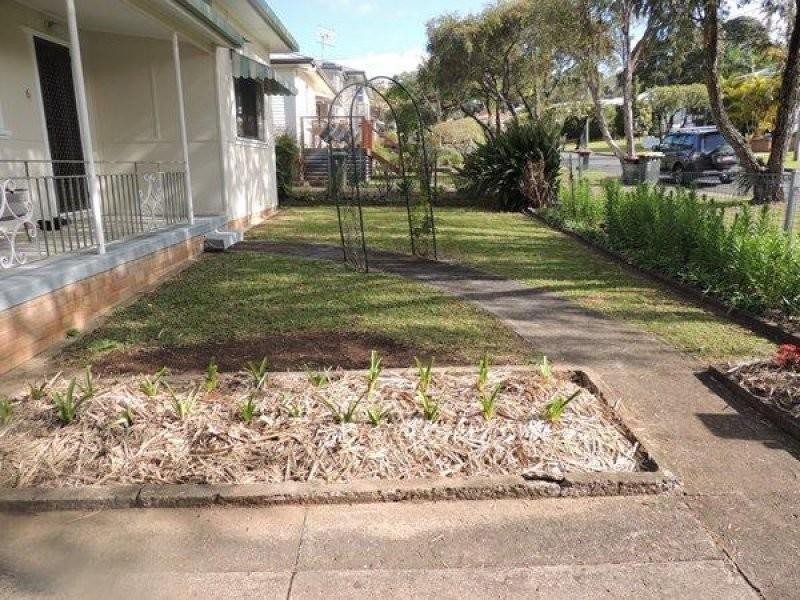
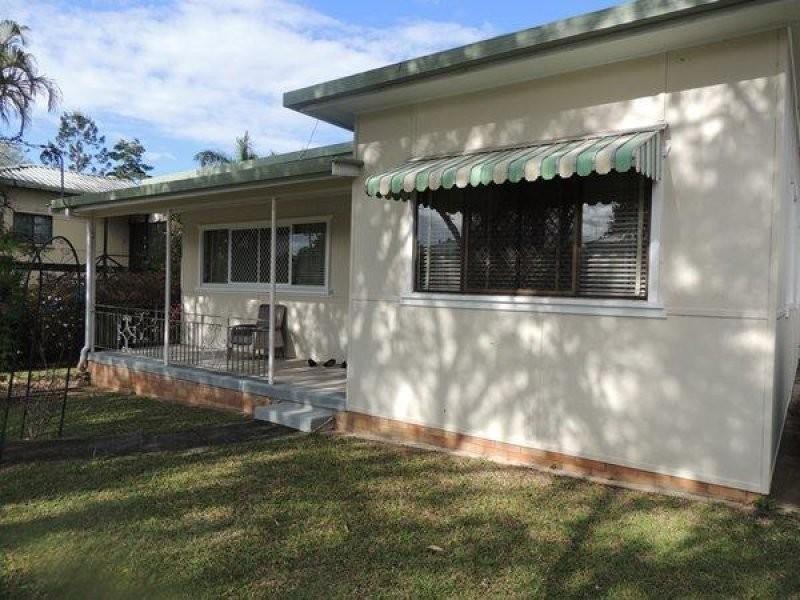
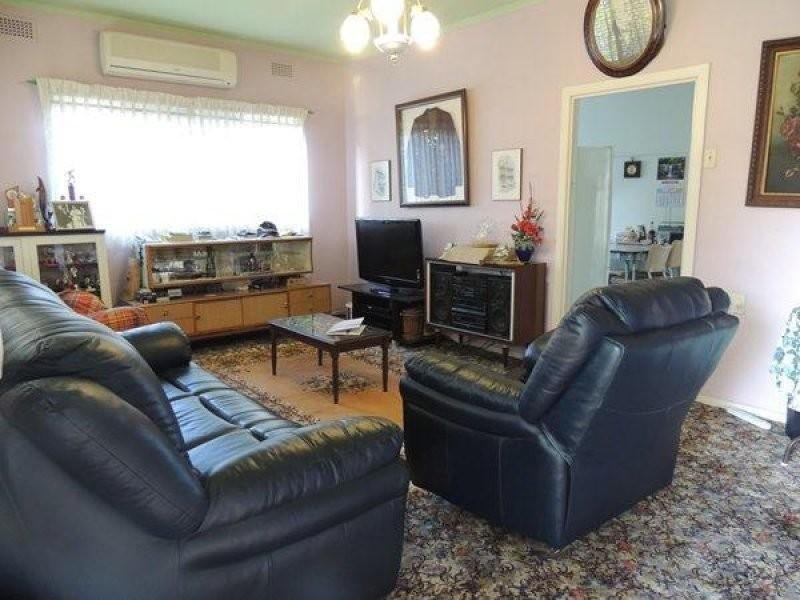
There are approximately 18,049 people living in Murwillumbah but… who are they?
44
49%
51%
Suburb Stats
$834/WK
$250/WK
$382/WK
Value of property in Murwillumbah and nearby suburbs
Murwillumbah
Sandy Beach
Woodburn
Brushgrove
Average Home Price$479,070Average Rental Price$346Household Size2.5
Average Home Price$456,850Average Rental Price$354Household Size2.5
Average Home Price$397,344Average Rental Price$339Household Size2.4
Average Home Price$460,239Average Rental Price$327Household Size2.4
Water Useper year per person
0.6mln. litres
State Average 0.74 mln. litres
Nat. Average 0.74 mln. litres
Greenhouse Pollutionper year per person
16.48tonnes
State Average 19.31 tonnes
Nat. Average 20.3 tonnes
Dwelling Types
91%
5%
3%
Most Common Suburb Professions
17% Professio…
15% Technicia…
14% Managers…
12% Labourers…
Nearby schools: mt st patrick college, murwillumbah community college, murwillumbah south infants school, murwillumbah high school
Nearby cafes: auto cafe, sugar beat cafe, the modern grocer, cenzo cafe
Nearby doctors: martine brinsdon, main street medical centre, king street dental practice - dr. evans michael, king street medical centre-dr john moran
Nearby hospitals: king street medical centre, murwillumbah district hospital, queen street medical centre