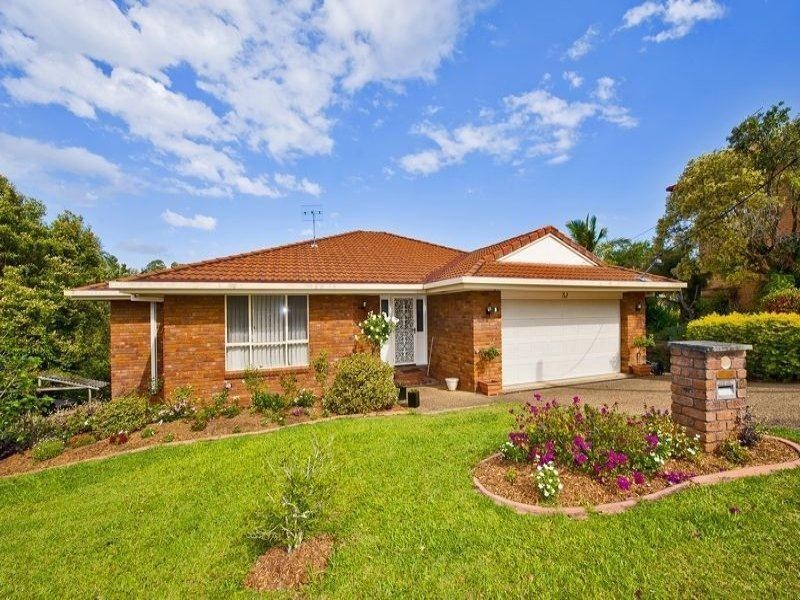
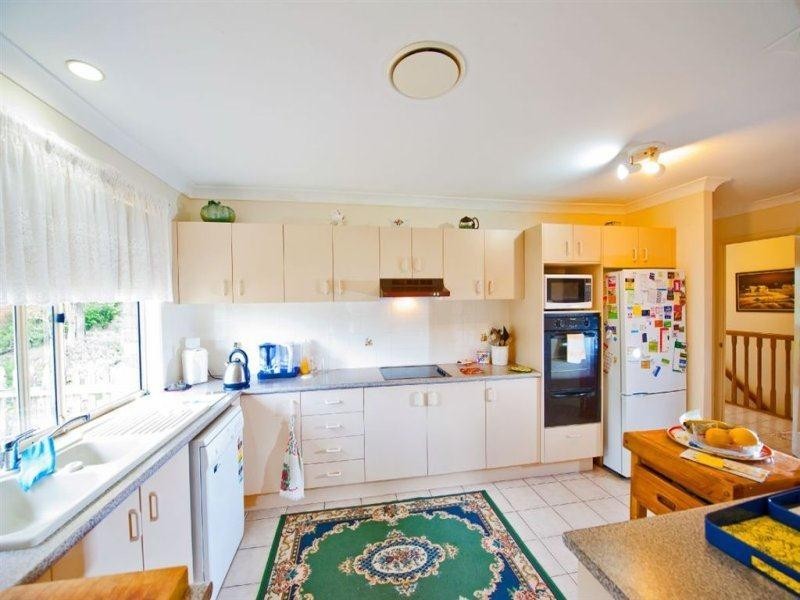
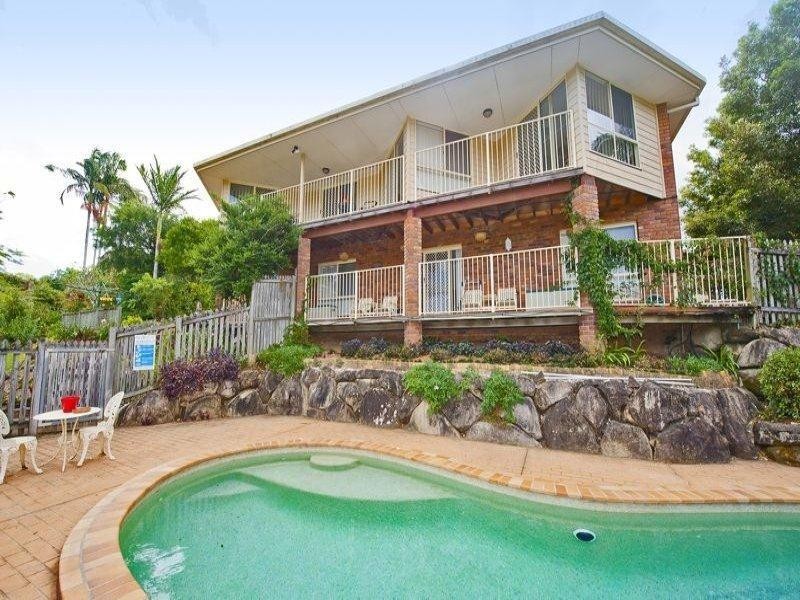
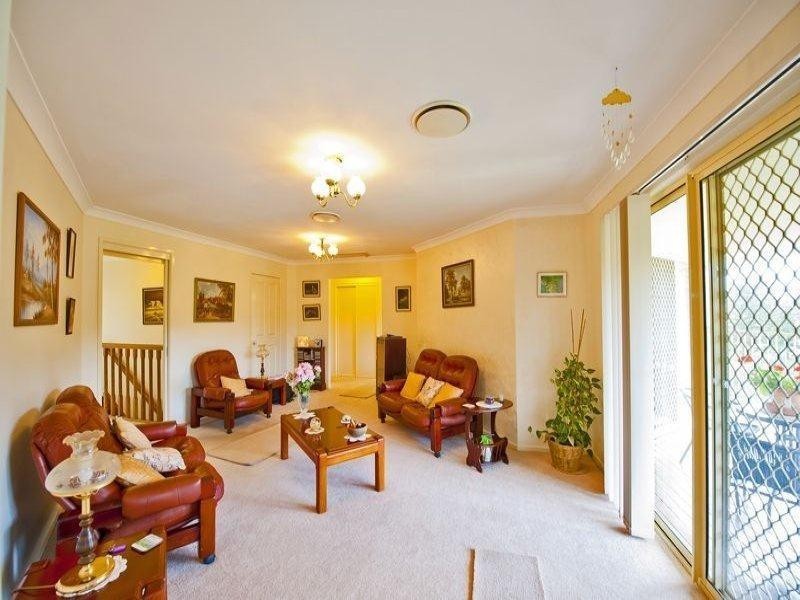
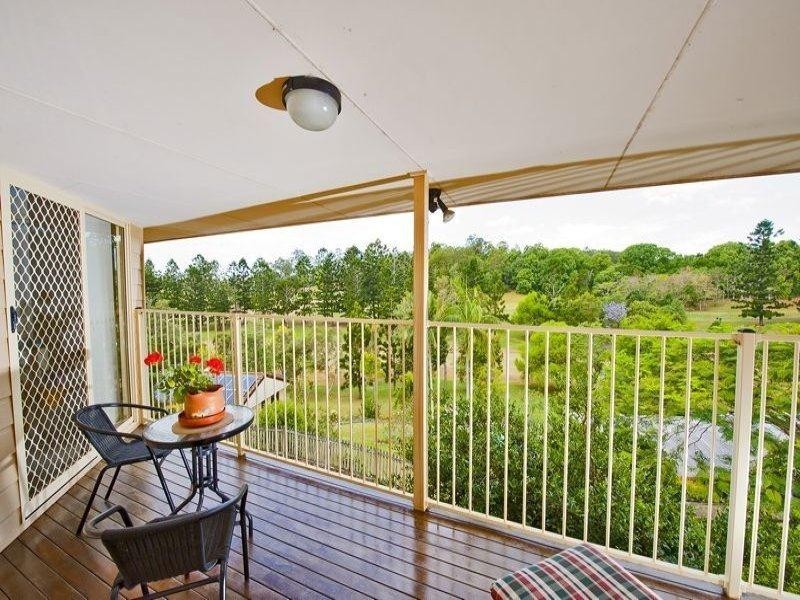
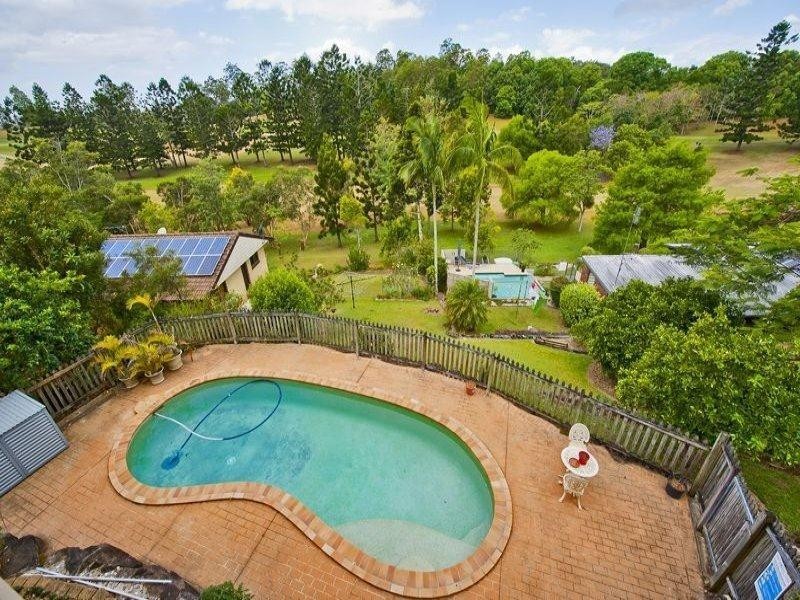
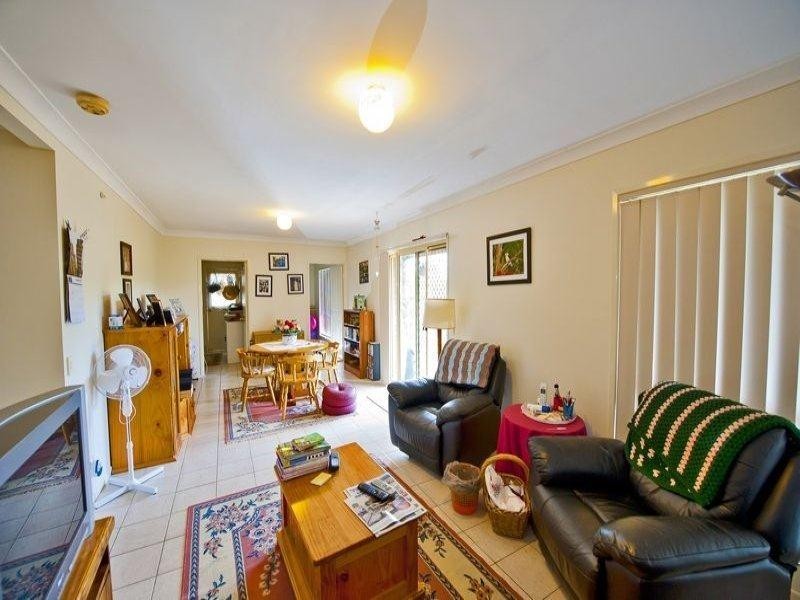
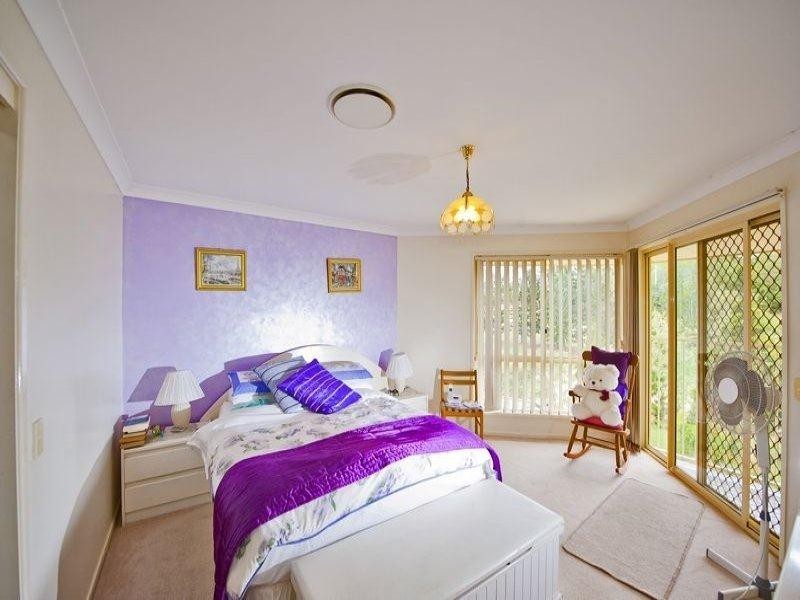
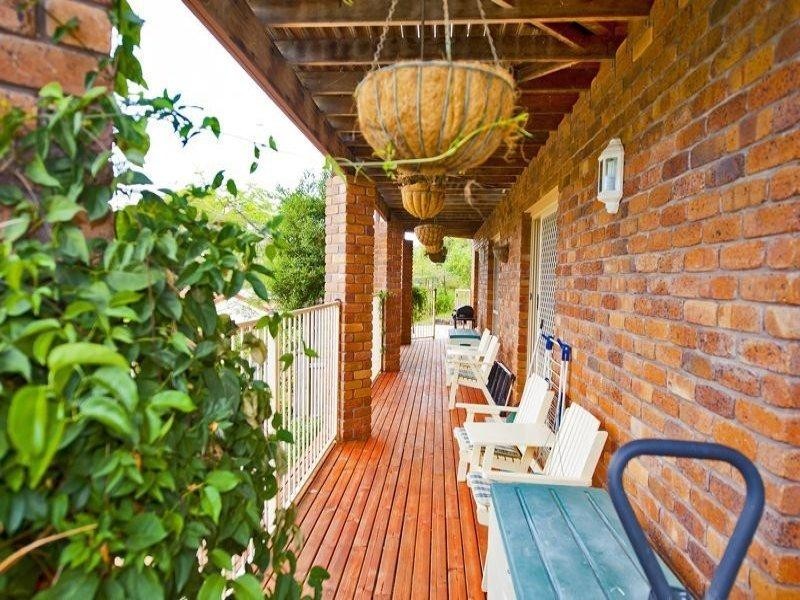
There are approximately 18,049 people living in Murwillumbah but… who are they?
44
49%
51%
Suburb Stats
$834/WK
$250/WK
$382/WK
Value of property in Murwillumbah and nearby suburbs
Murwillumbah
Mullumbimby
Duranbah
Chillingham
Average Home Price$479,070Average Rental Price$346Household Size2.5
Average Home Price$889,914Average Rental Price$597Household Size2.4
Average Home Price$881,000Average Rental Price$515Household Size2.3
Average Home Price$484,579Average Rental Price$325Household Size2.5
Water Useper year per person
0.6mln. litres
State Average 0.74 mln. litres
Nat. Average 0.74 mln. litres
Greenhouse Pollutionper year per person
16.48tonnes
State Average 19.31 tonnes
Nat. Average 20.3 tonnes
Dwelling Types
91%
5%
3%
Most Common Suburb Professions
17% Professio…
15% Technicia…
14% Managers…
12% Labourers…
Nearby schools: mt st patrick college, murwillumbah south infants school, murwillumbah east primary school, murwillumbah community college
Nearby cafes: sugar beat cafe, the blue frog, king street cafe, cenzo cafe
Nearby doctors: qml pathology, king street medical centre-dr yabsley robyn, king street dental practice - dr. evans michael, queen street medical centre
Nearby hospitals: queen street medical centre, king street medical centre, murwillumbah district hospital