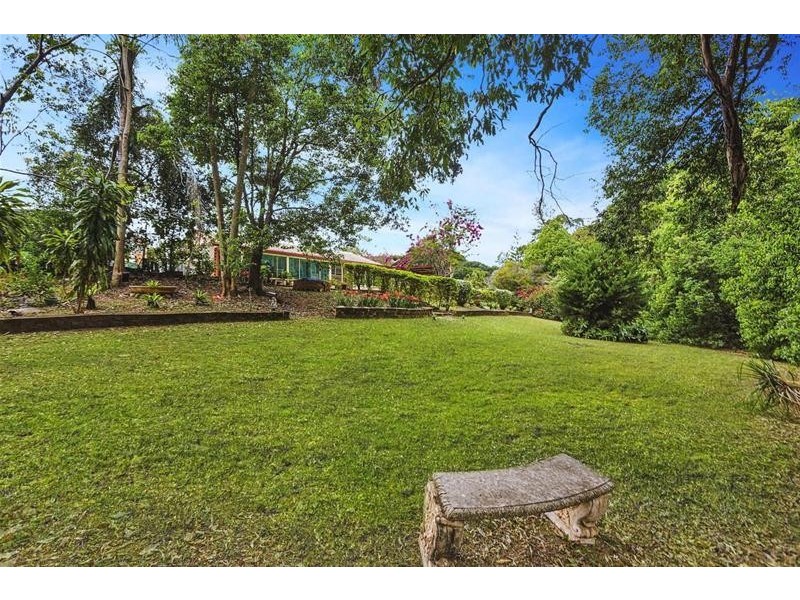
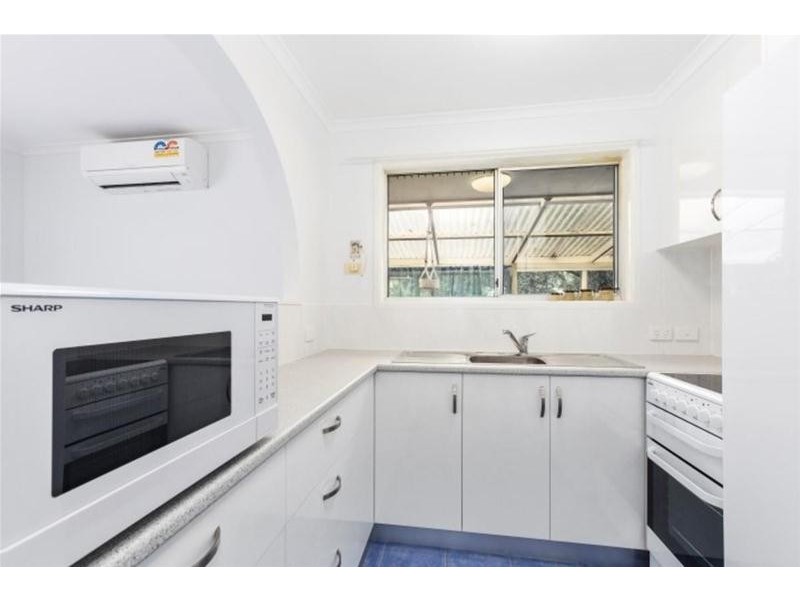
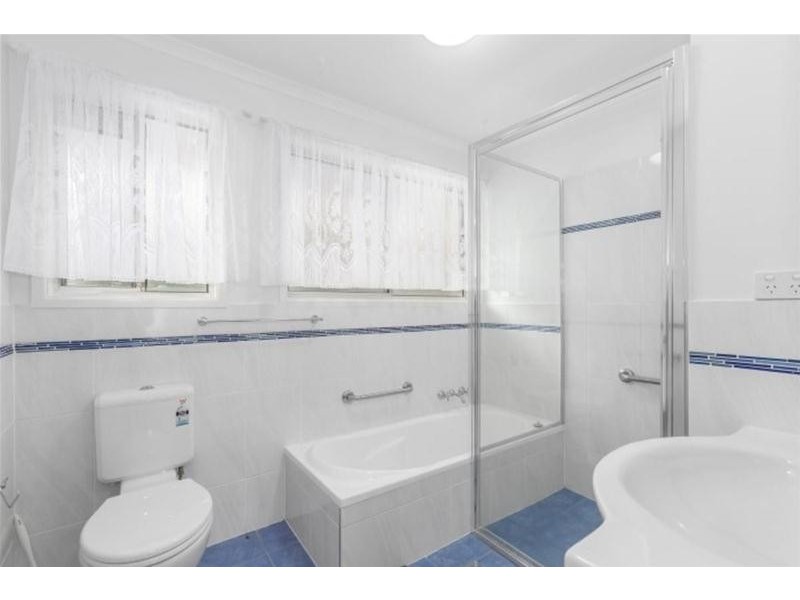
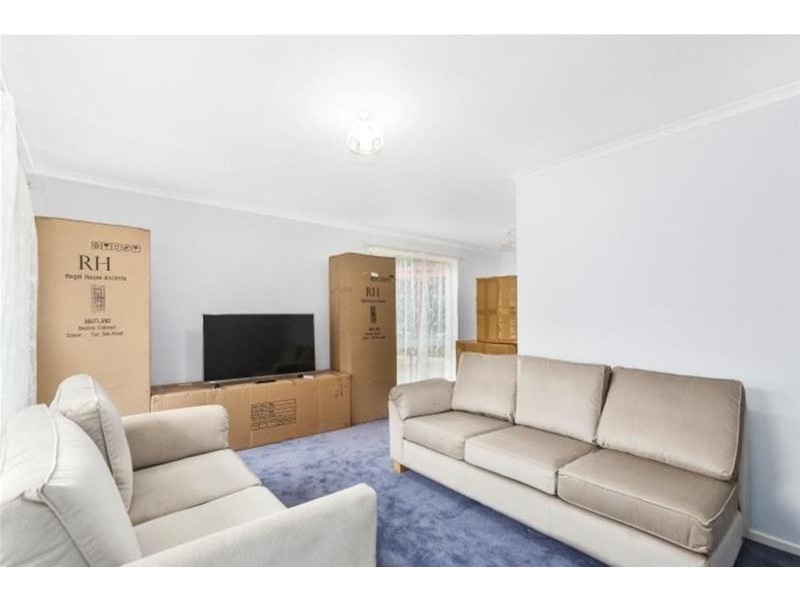
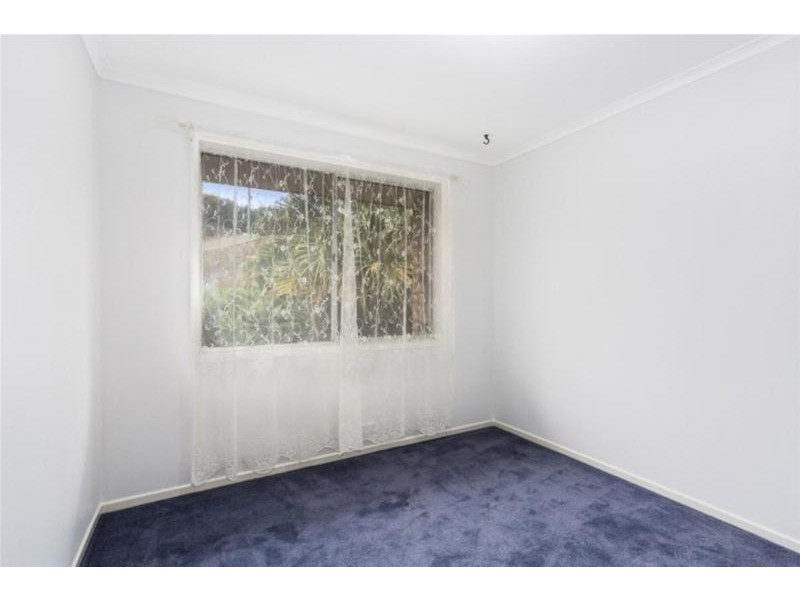
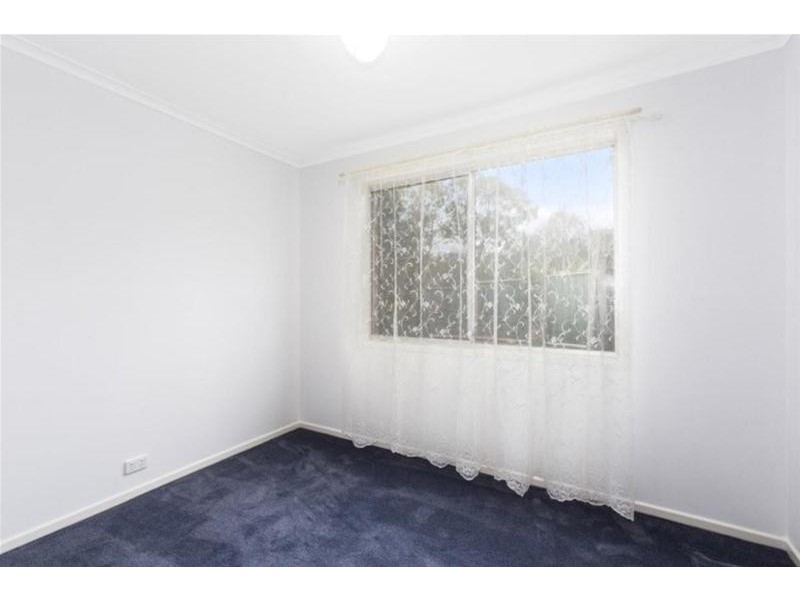
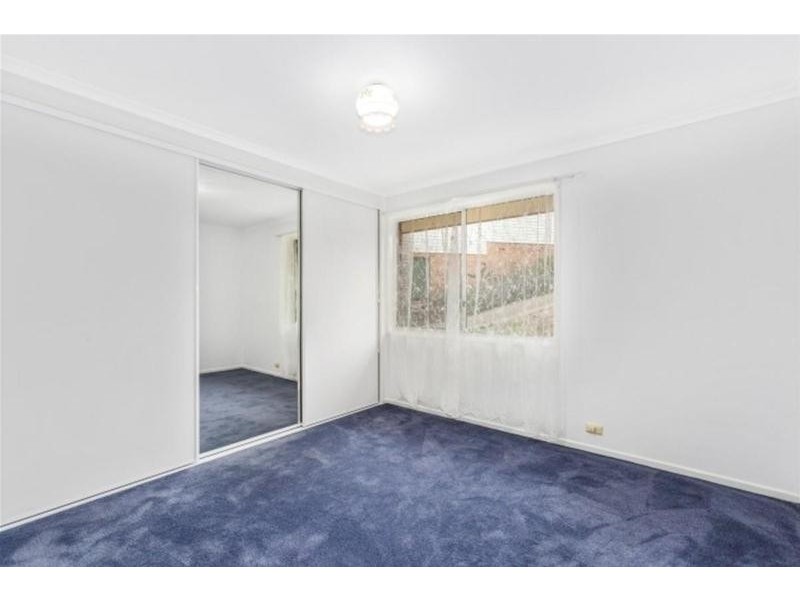
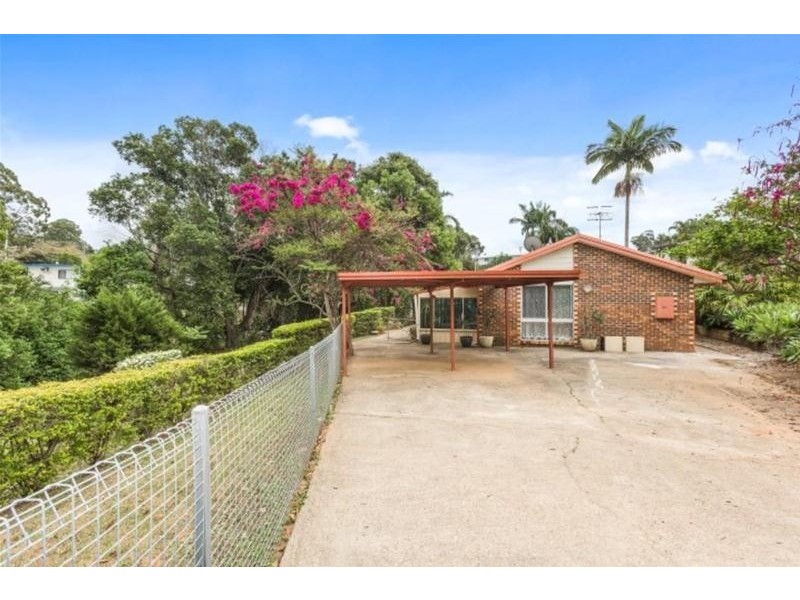
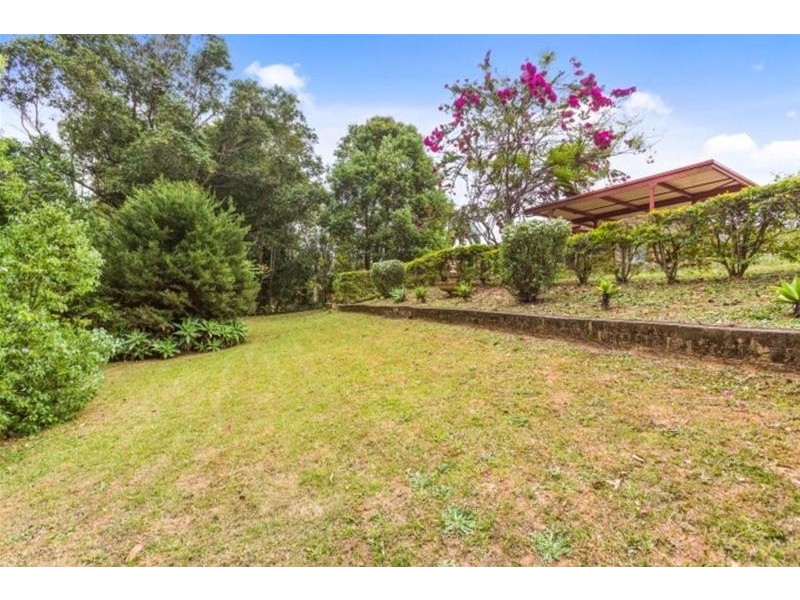
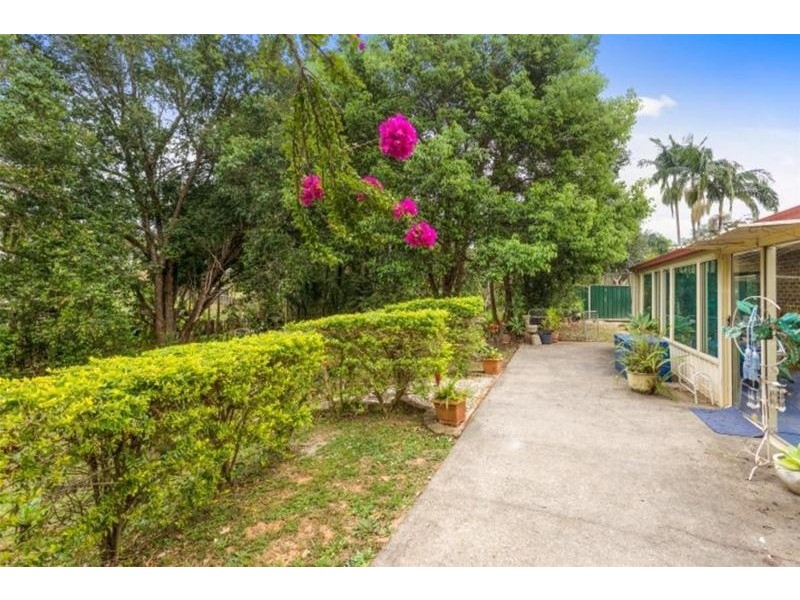
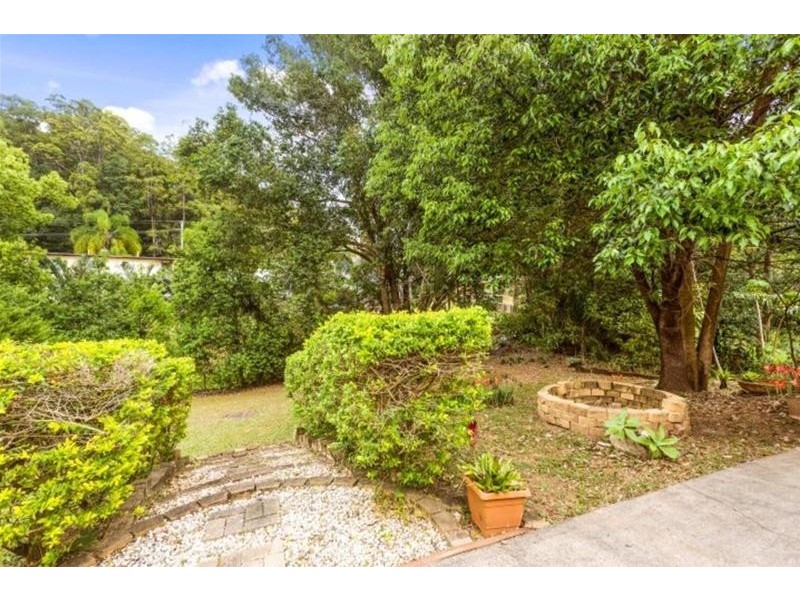
45 Tombonda Road, Murwillumbah NSW 2484 REDUCED IN PRICE $420,000 Listing history: 29 Sep, 2017 3 1 2 Listing ID: 34903563 Other properties for sale near 45 Tombonda Road, Murwillumbah NSW 2484 2/27 Tombonda Road, Murwillumbah NSW 2484 2/27 Tombonda Road, Murwillumbah NSW 2484 2/27 TOMBONDA ROAD, Murwillumbah NSW 2484 2 Tombonda Road, Murwillumbah NSW 2484 18 Tombonda Road, Murwillumbah NSW 2484 Location THIS PROPERTY WAS SOLD Enquiry about this property Name* Email* Phone* Message* Send me regular newsletters from Homehound Have agents get in touch about similar properties within the area What is 8 + 20?* Receive email alerts for properties like this Email alerts Email* Send me regular newsletters from Homehound. Have agents get in touch about similar properties within the area What is 8 + 20?*