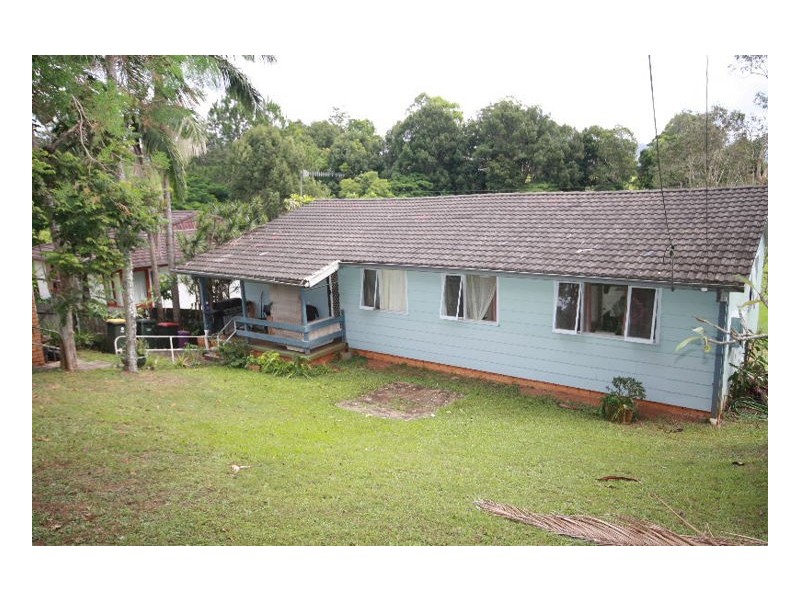
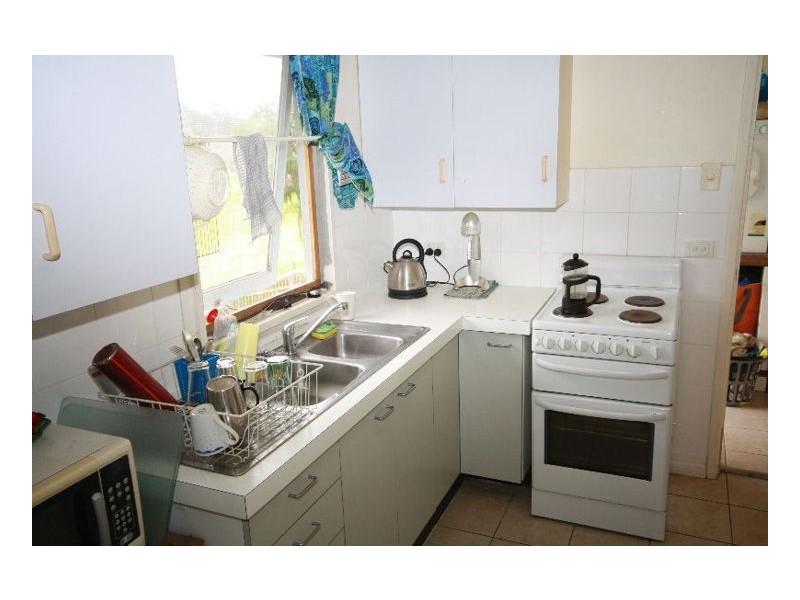
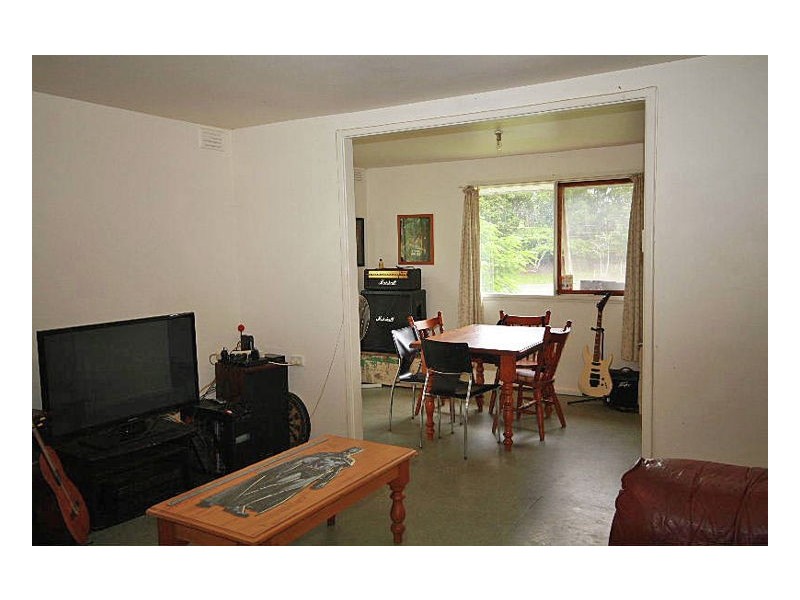
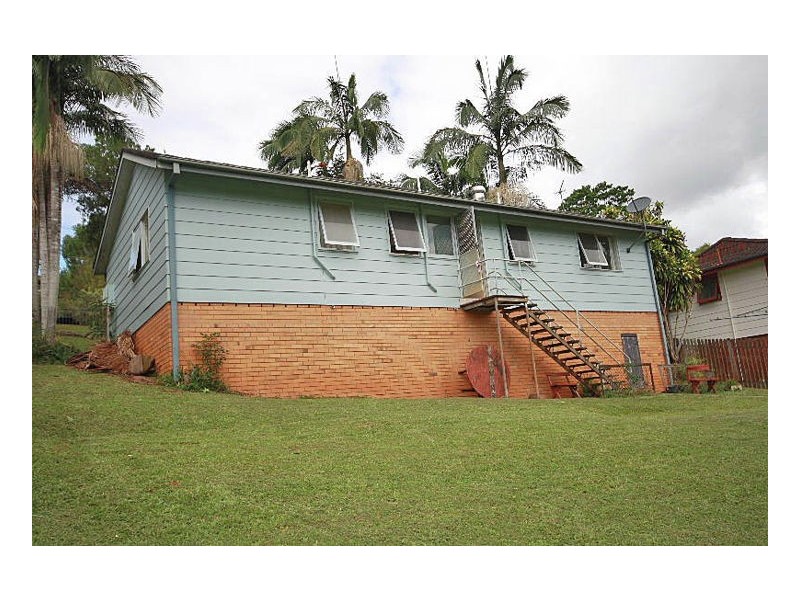
23 Hall Drive, Murwillumbah NSW 2484 ROLL UP YOUR SLEEVES!! $319,000 Listing history: 25 Jun, 2009 27 Apr, 2016 4 1 1 Listing ID: 31295113 Other properties for sale near 23 Hall Drive, Murwillumbah NSW 2484 46A Hall Drive, Murwillumbah NSW 2484 54 Hall Drive, Murwillumbah NSW 2484 42 HALL DRIVE, Murwillumbah NSW 2484 6 HALL DRIVE, Murwillumbah NSW 2484 60 Hall Drive, Murwillumbah NSW 2484 Location THIS PROPERTY WAS SOLD Enquiry about this property Name* Email* Phone* Message* Send me regular newsletters from Homehound Have agents get in touch about similar properties within the area What is 8 + 20?* Receive email alerts for properties like this Email alerts Email* Send me regular newsletters from Homehound. Have agents get in touch about similar properties within the area What is 8 + 20?*