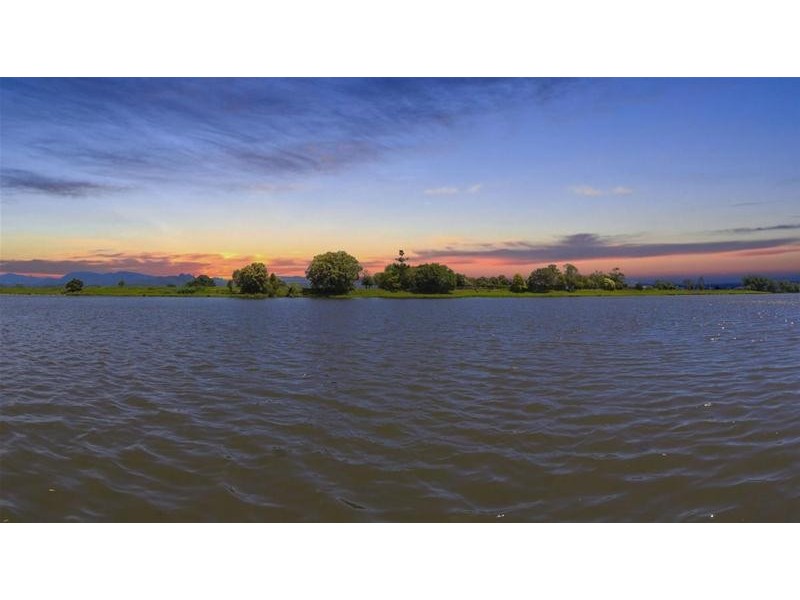
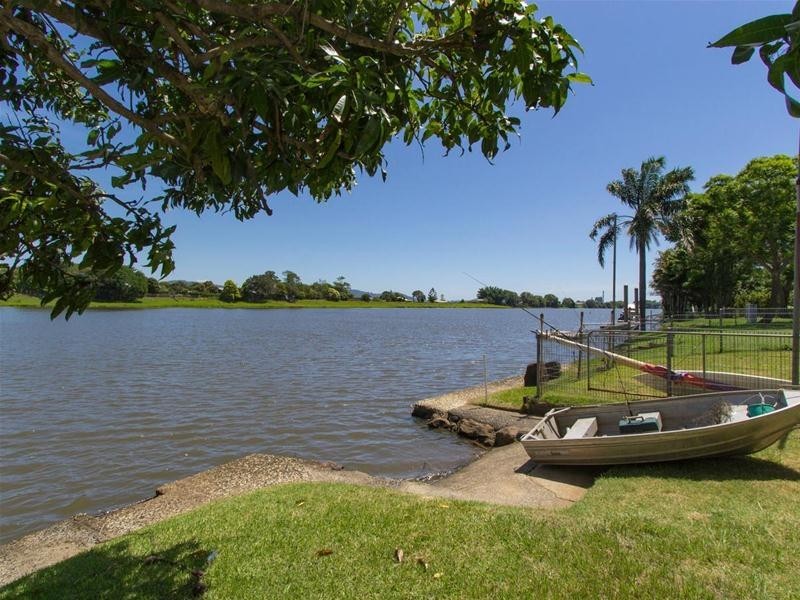
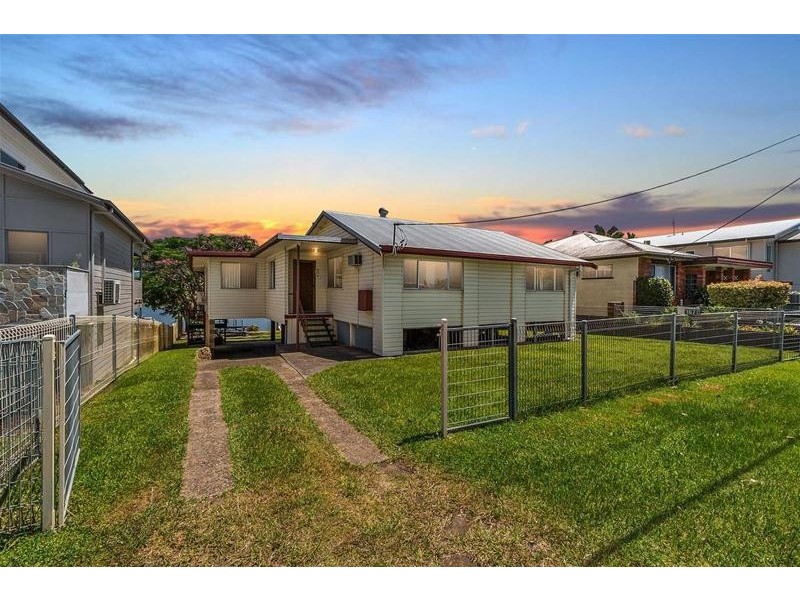
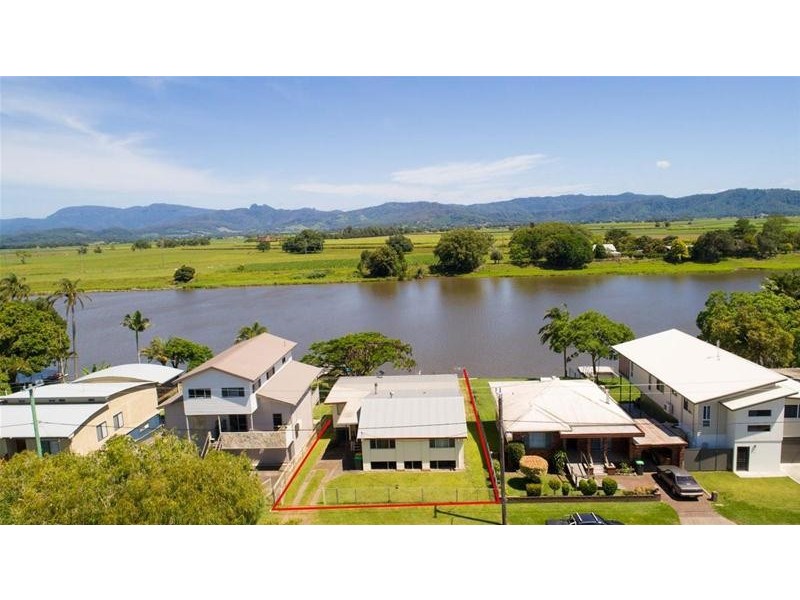
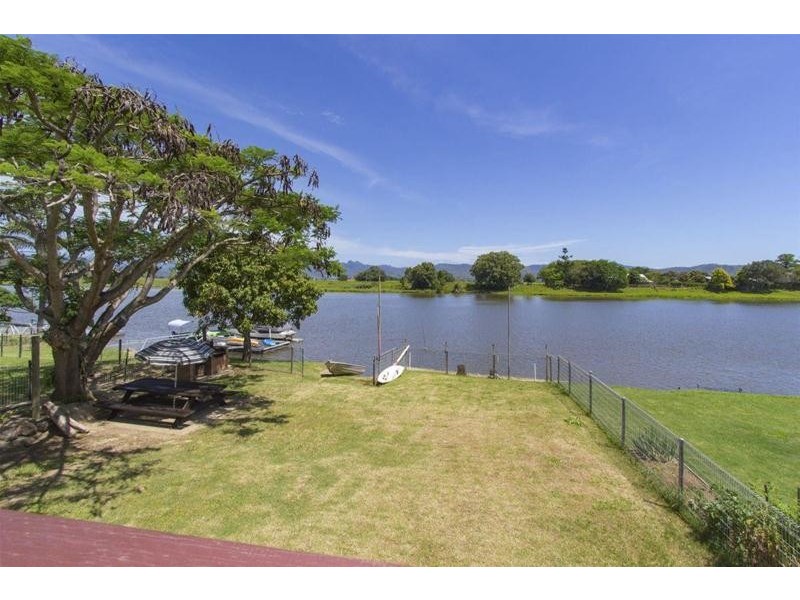
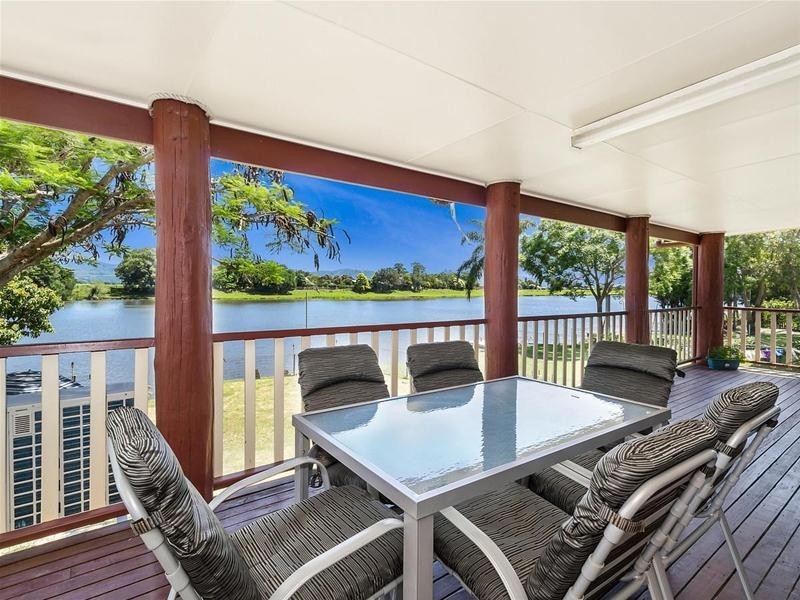
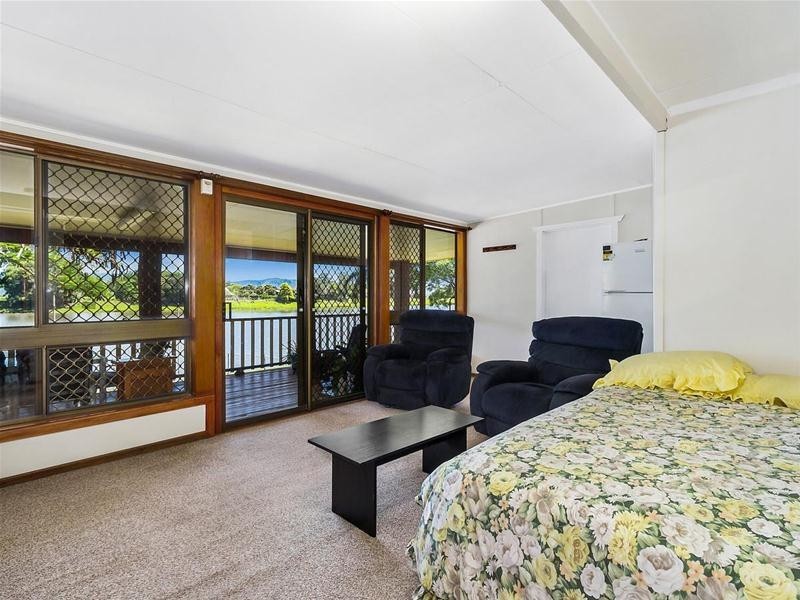
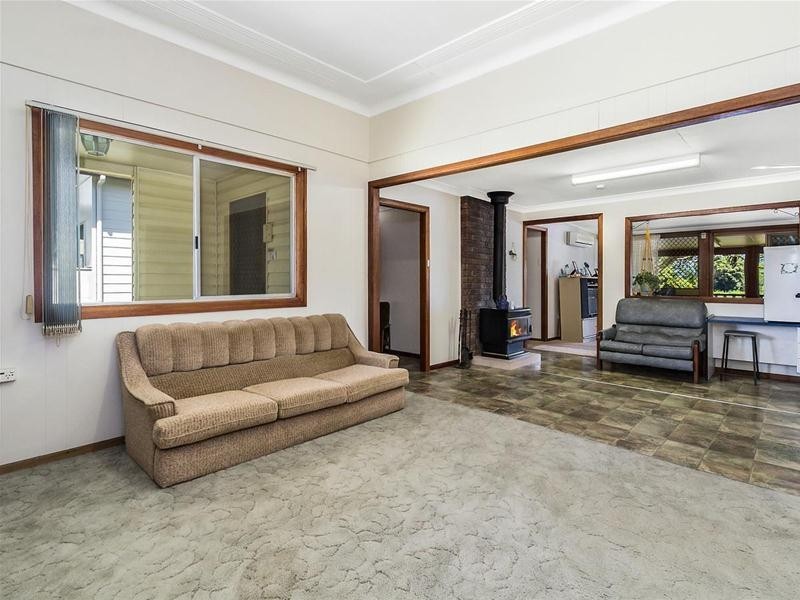
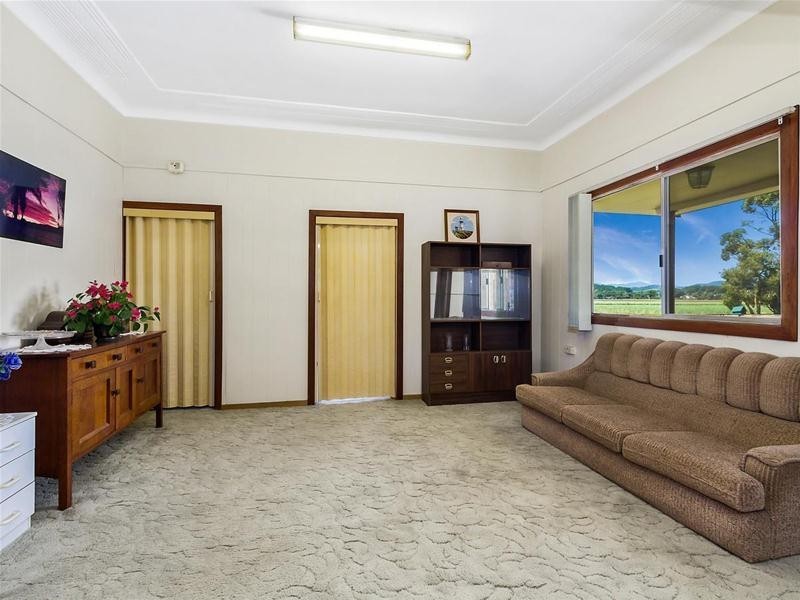
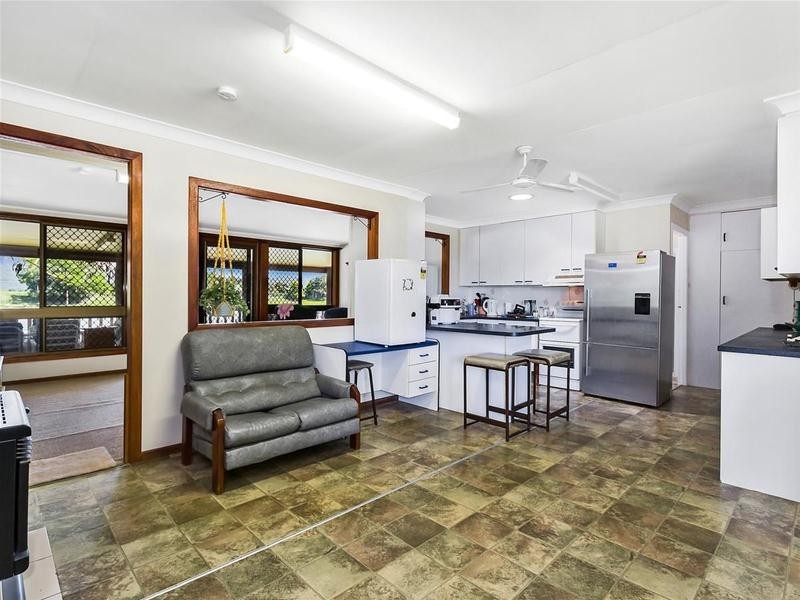
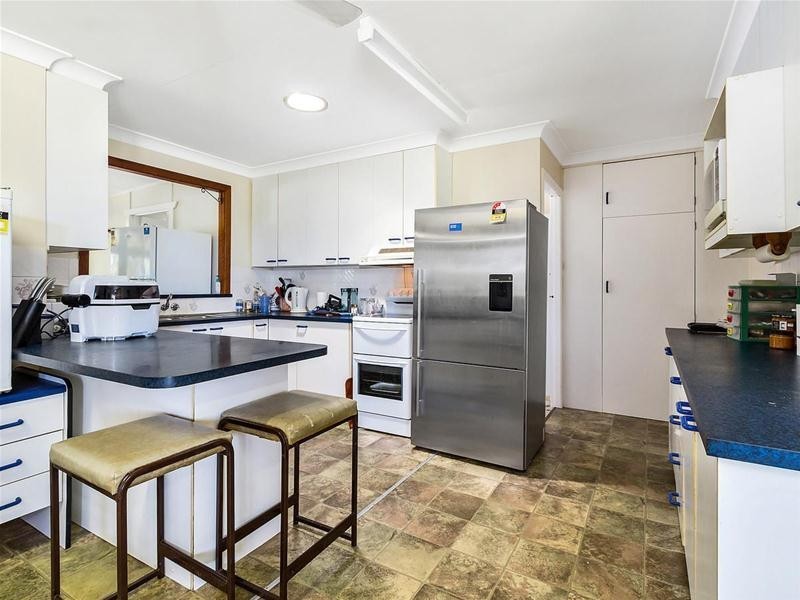
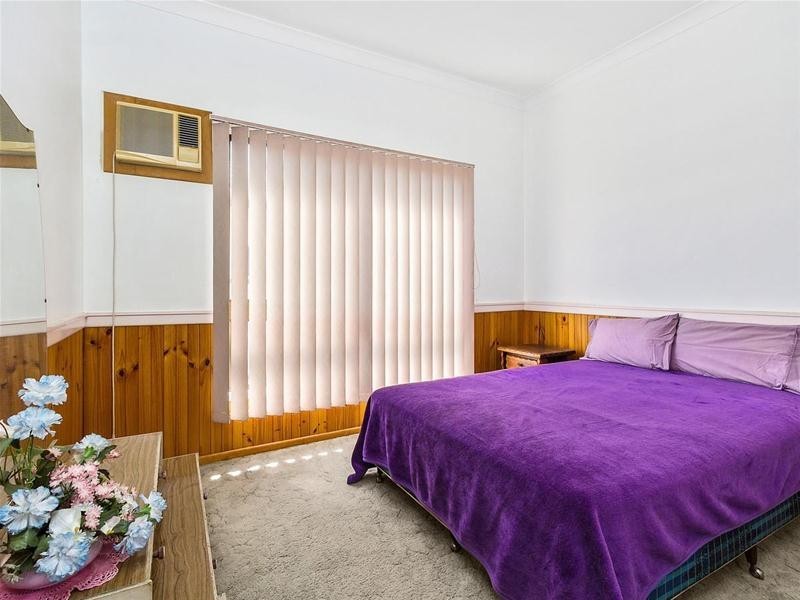
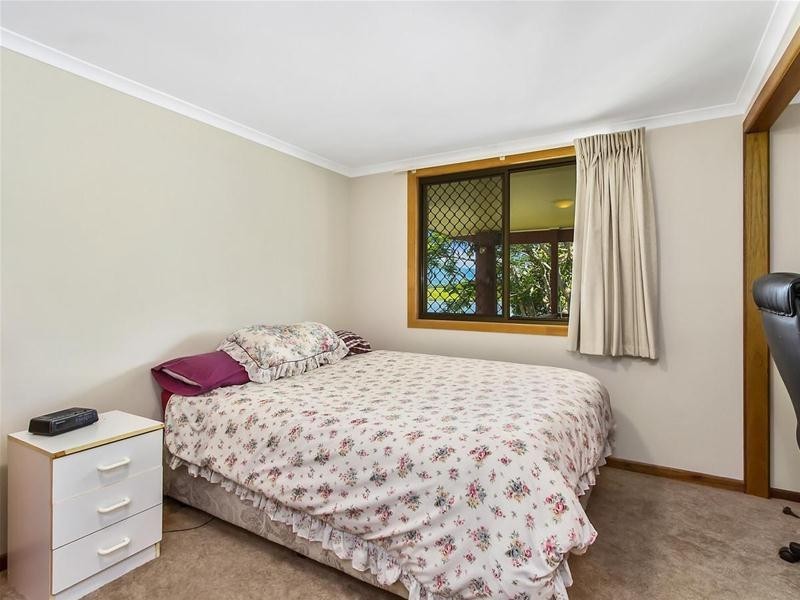
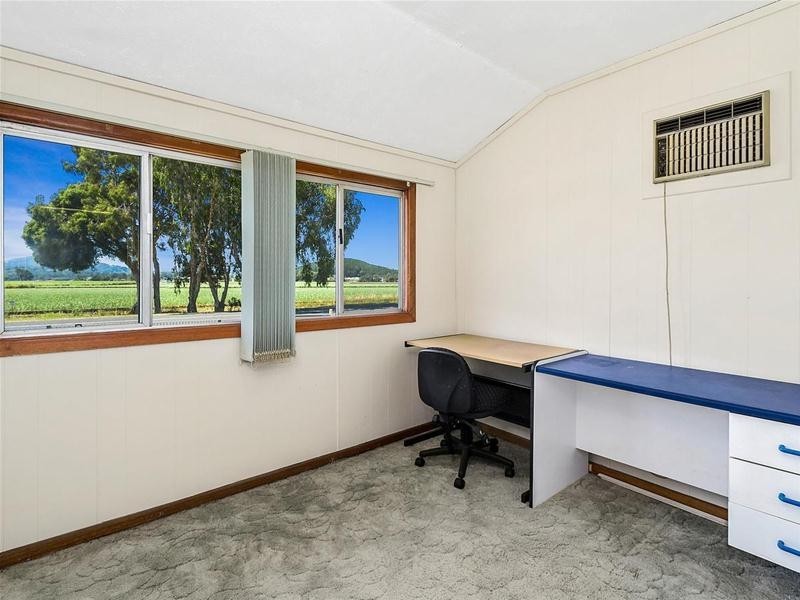
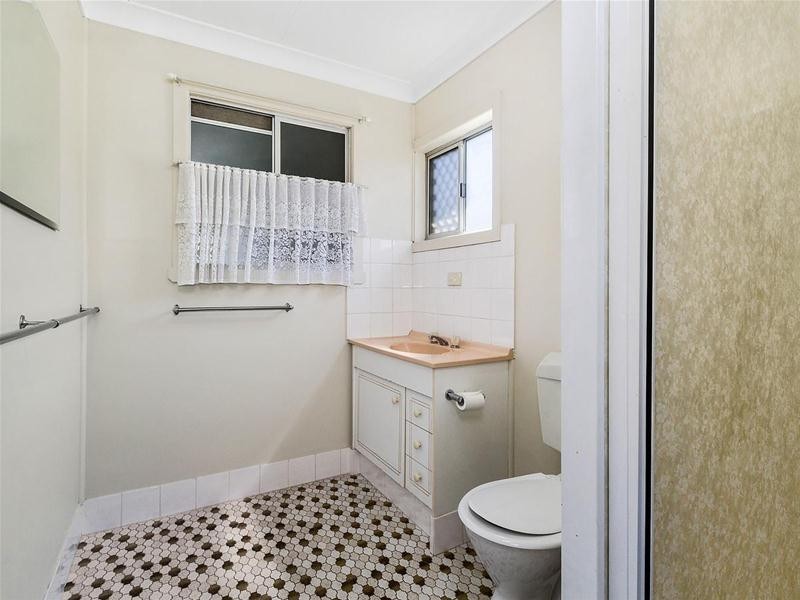
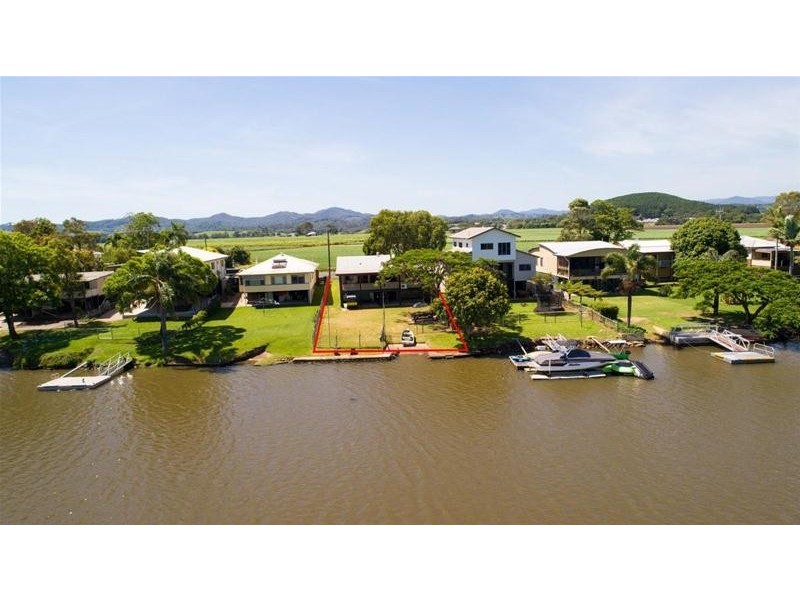
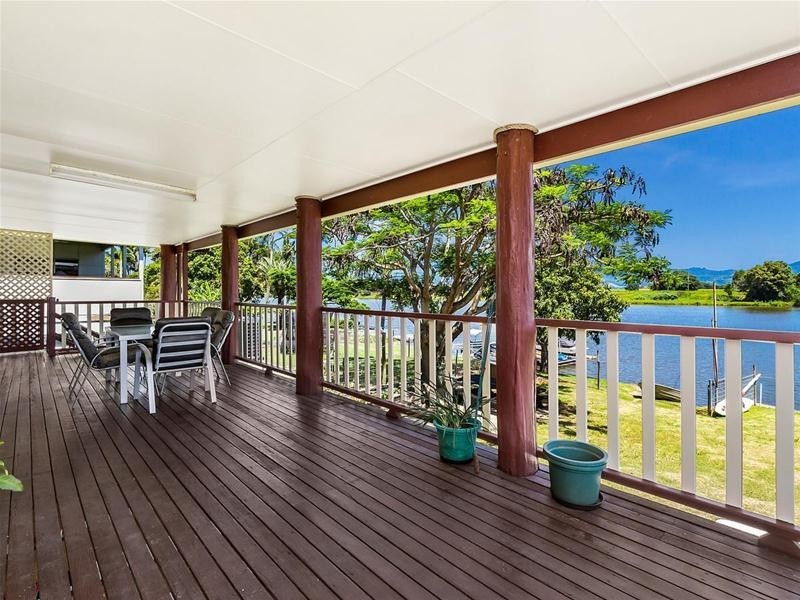
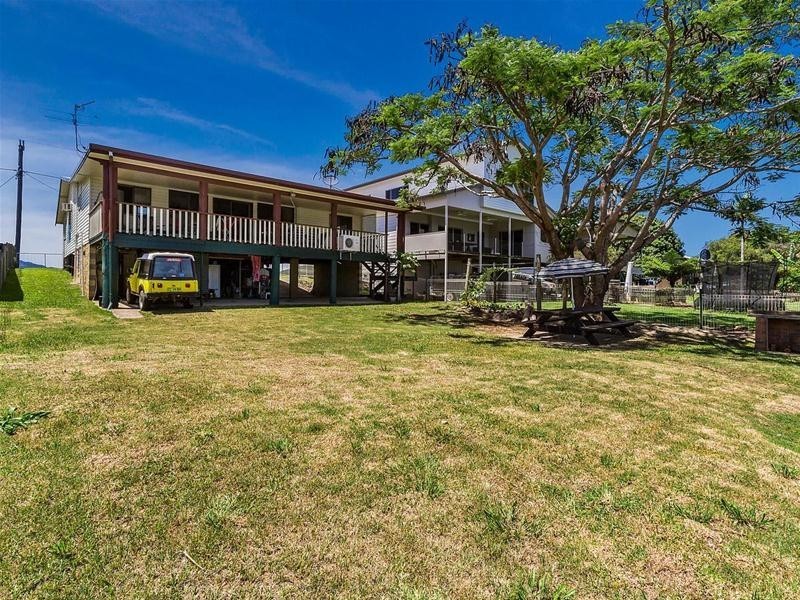
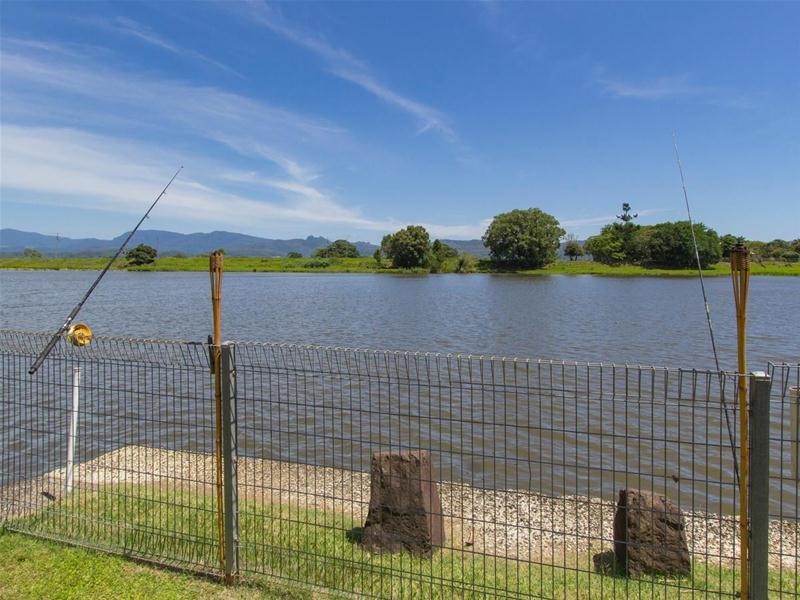
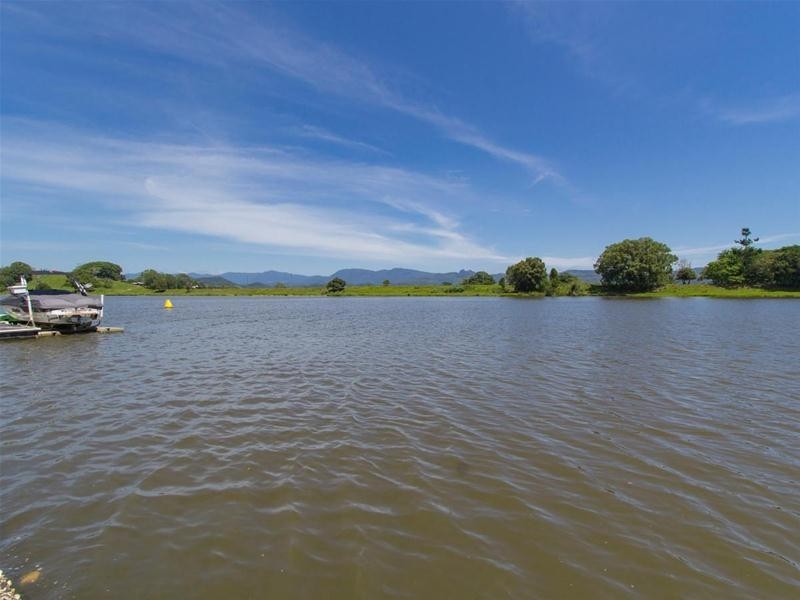
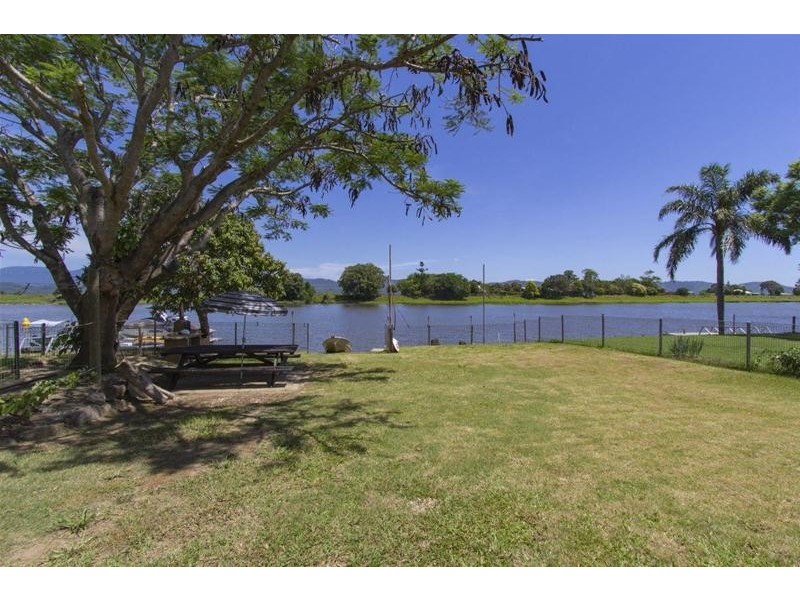
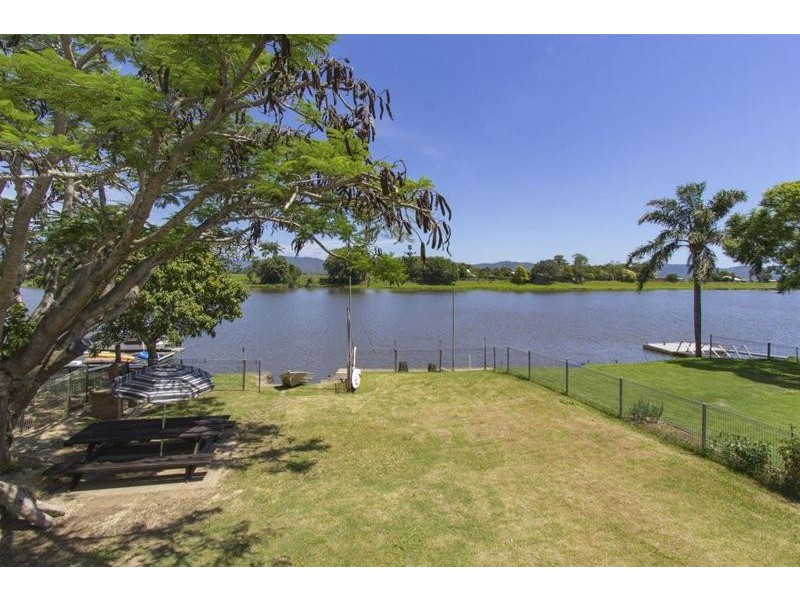
167 Tweed Valley Way, Murwillumbah NSW 2484 Riverfront Living $650,000 Listing history: 21 Dec, 2017 27 Sep, 2018 10 Apr, 2019 4 2 4 Listing ID: 35426983 Other properties for sale near 167 Tweed Valley Way, Murwillumbah NSW 2484 47 Tweed Valley Way, South Murwillumbah NSW 2484 39 Tweed Valley Way, Murwillumbah NSW 2484 243 Tweed Valley Way, Murwillumbah NSW 2484 1 Tumbulgum Road, Murwillumbah NSW 2484 86 BYANGUM ROAD, Murwillumbah NSW 2484 Location THIS PROPERTY WAS SOLD Enquiry about this property Name* Email* Phone* Message* Send me regular newsletters from Homehound Have agents get in touch about similar properties within the area What is 8 + 20?* Receive email alerts for properties like this Email alerts Email* Send me regular newsletters from Homehound. Have agents get in touch about similar properties within the area What is 8 + 20?*