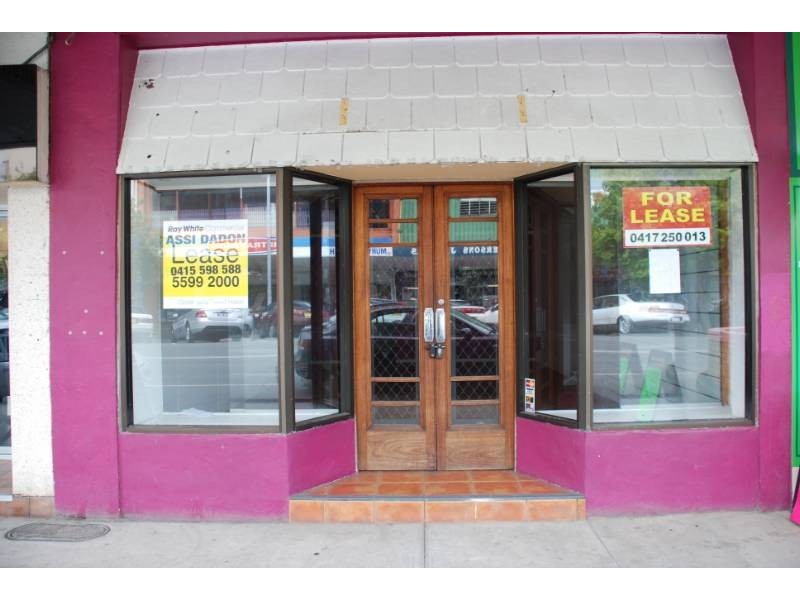
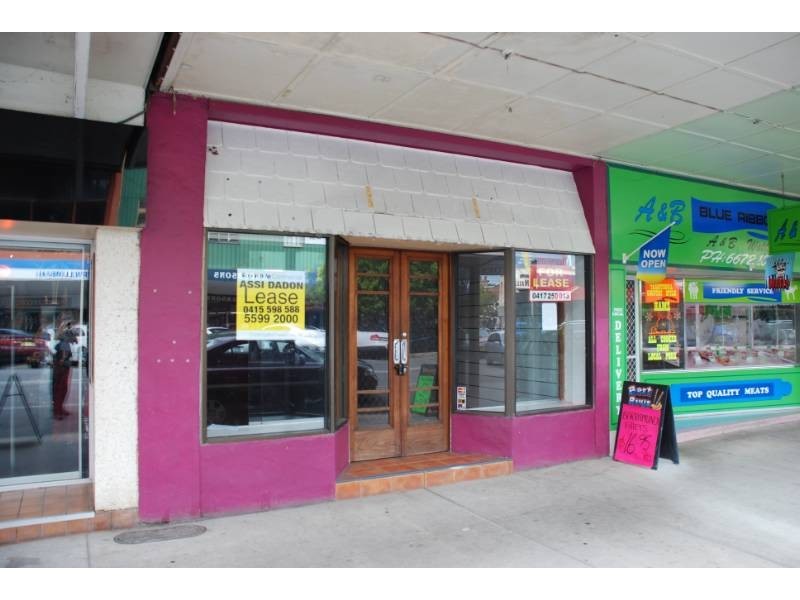
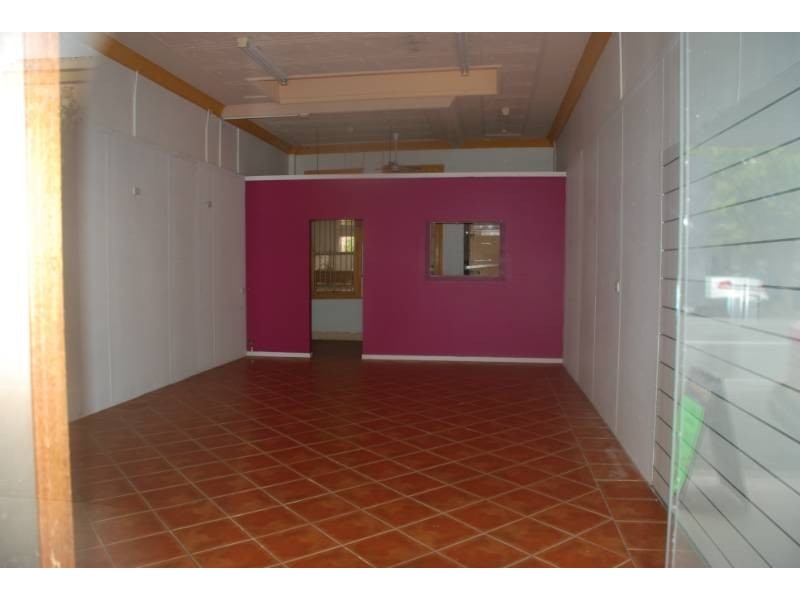
95 Murwillumbah Street, Murwillumbah NSW 2484 In the heart of town $17160 p/a incl gst Listing history: 11 Dec, 2012 0 0 0 Listing ID: 18891208 Other properties to rent near 95 Murwillumbah Street, Murwillumbah NSW 2484 3/44 Brisbane Street, Murwillumbah NSW 2484 88 Murwillumbah Street, Murwillumbah NSW 2484 Unit 2/5 Nullum Street, Murwillumbah NSW 2484 3/11 Harwood Street, Murwillumbah NSW 2484 1/24 Joshua Street, Murwillumbah NSW 2484 Location THIS PROPERTY WAS LEASED Enquiry about this property Name* Email* Phone* Message* Send me regular newsletters from Homehound Have agents get in touch about similar properties within the area What is 8 + 20?* Receive email alerts for properties like this Email alerts Email* Send me regular newsletters from Homehound. Have agents get in touch about similar properties within the area What is 8 + 20?*