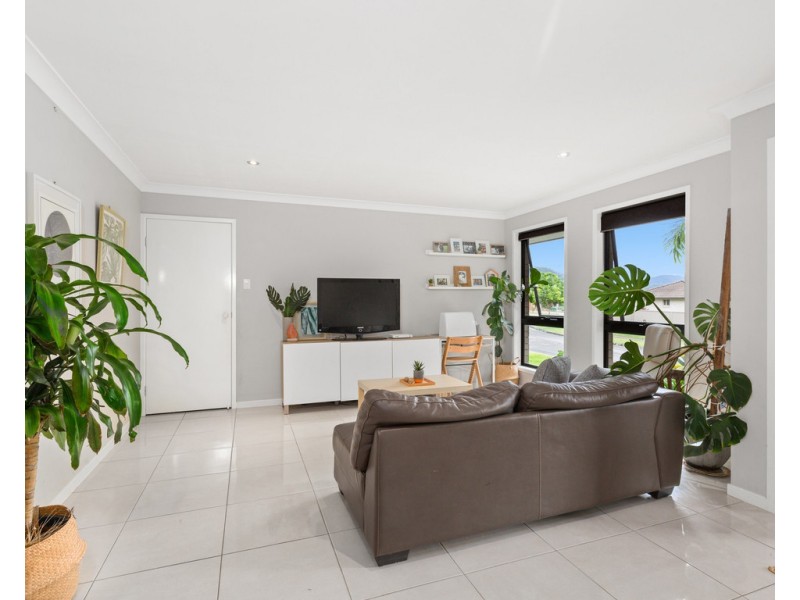
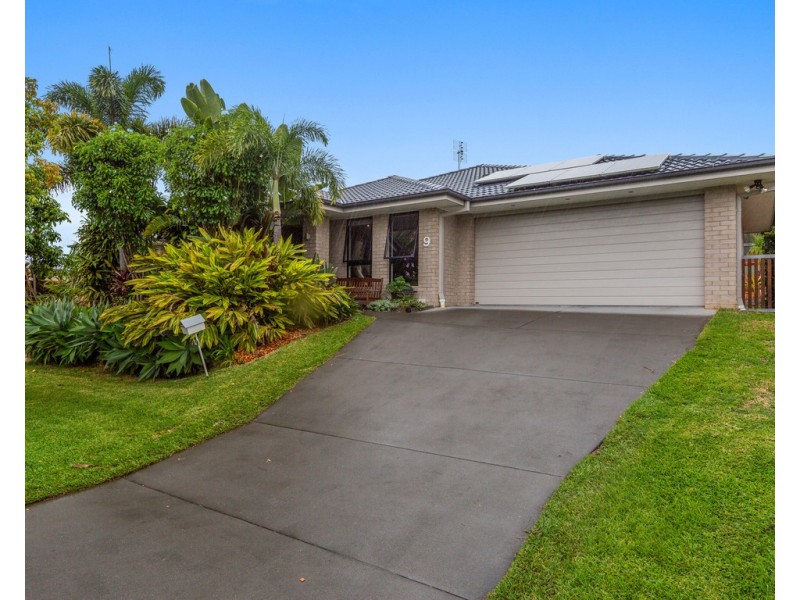
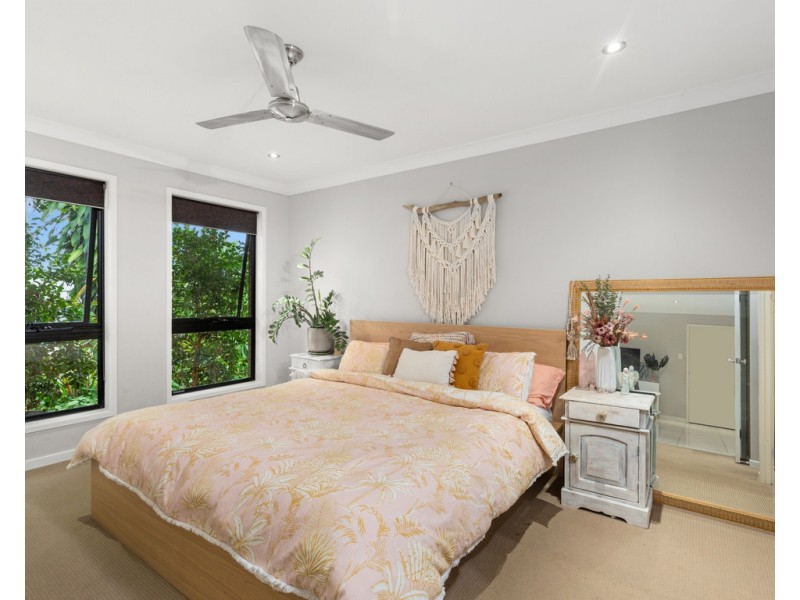
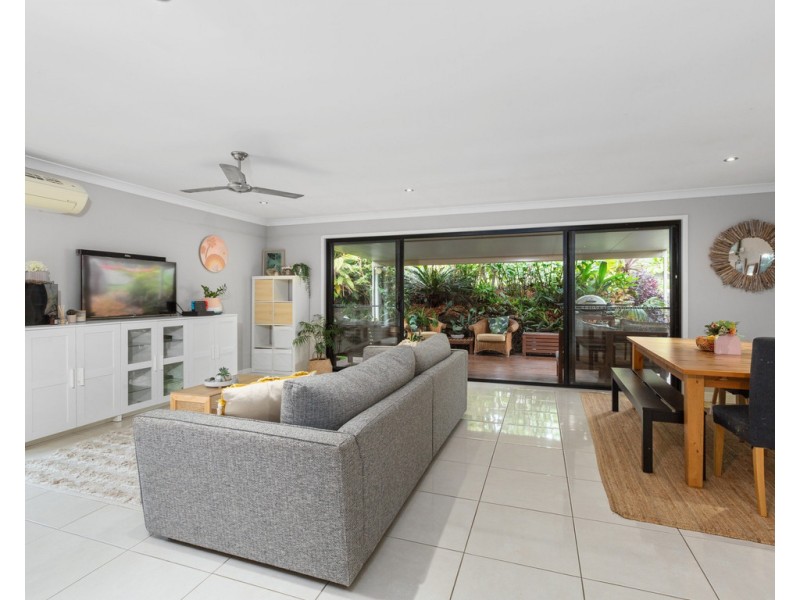
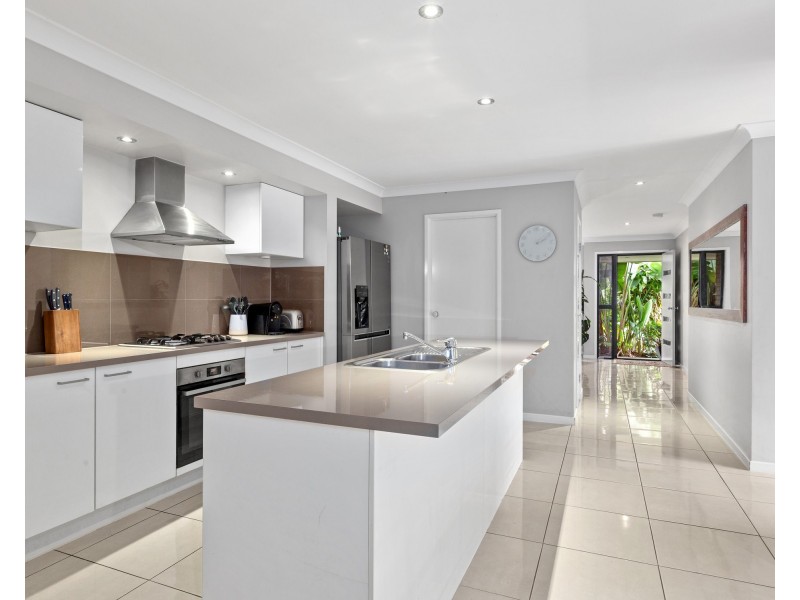
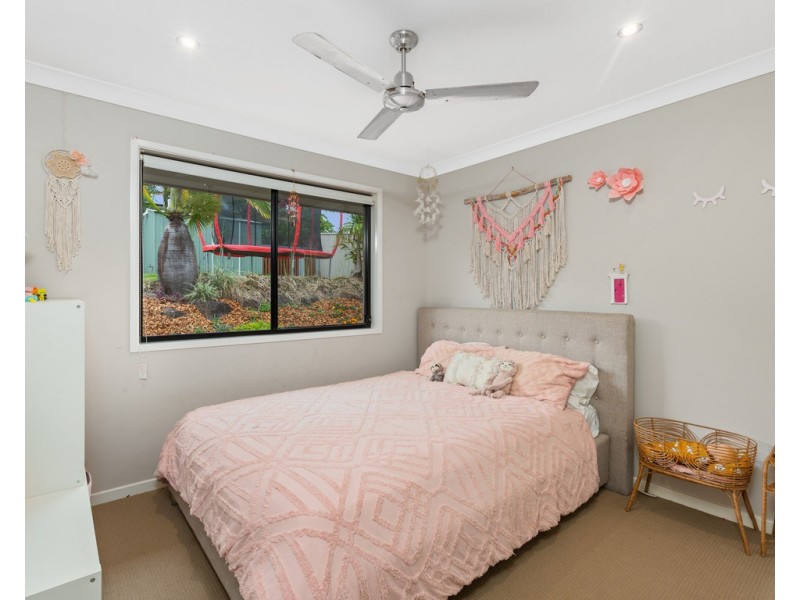
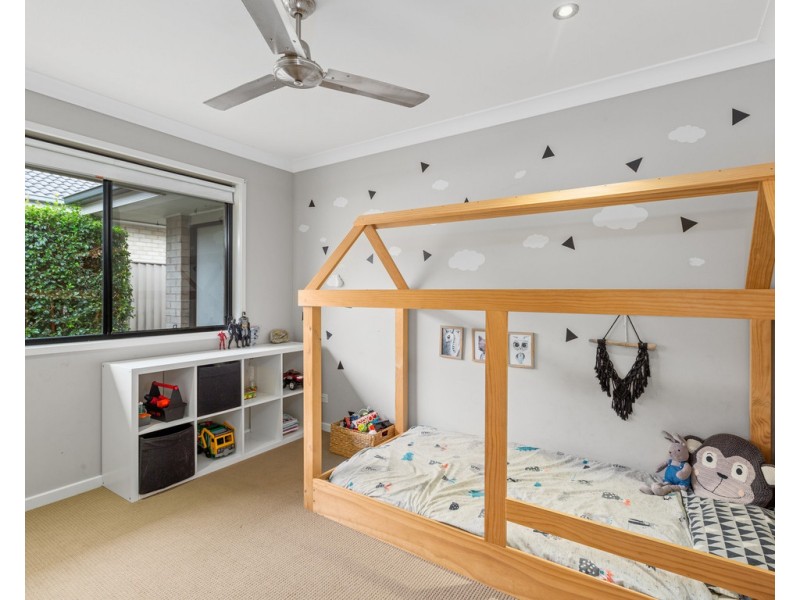
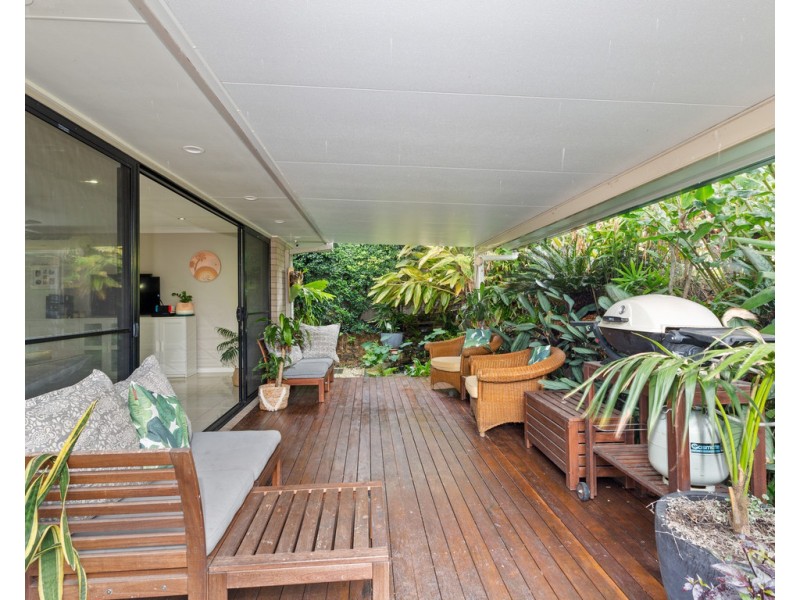
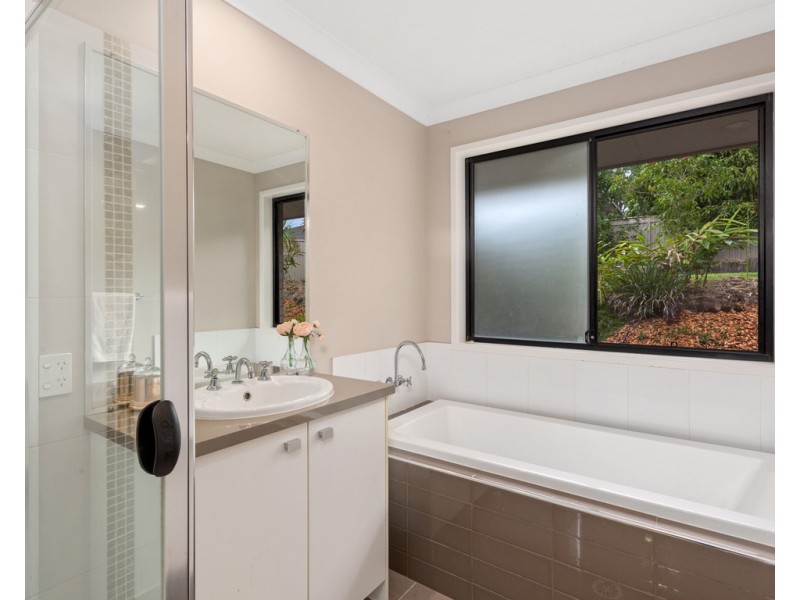
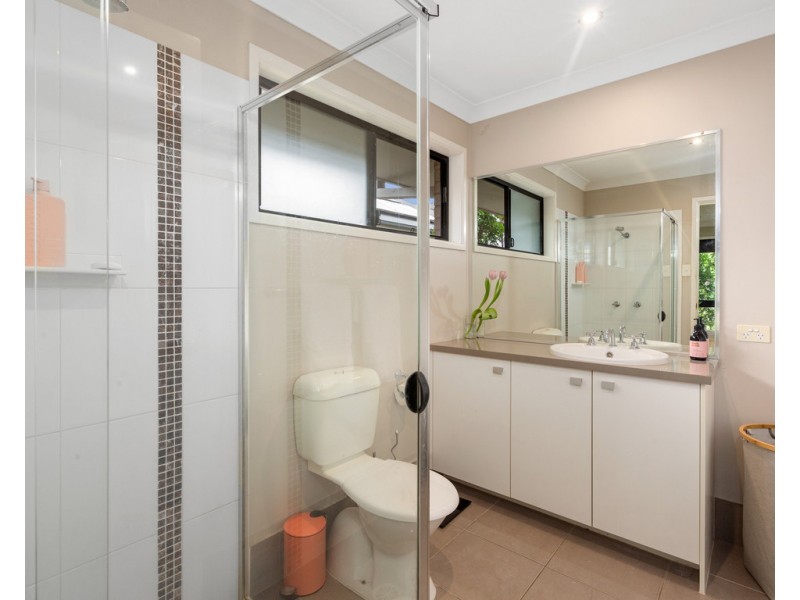
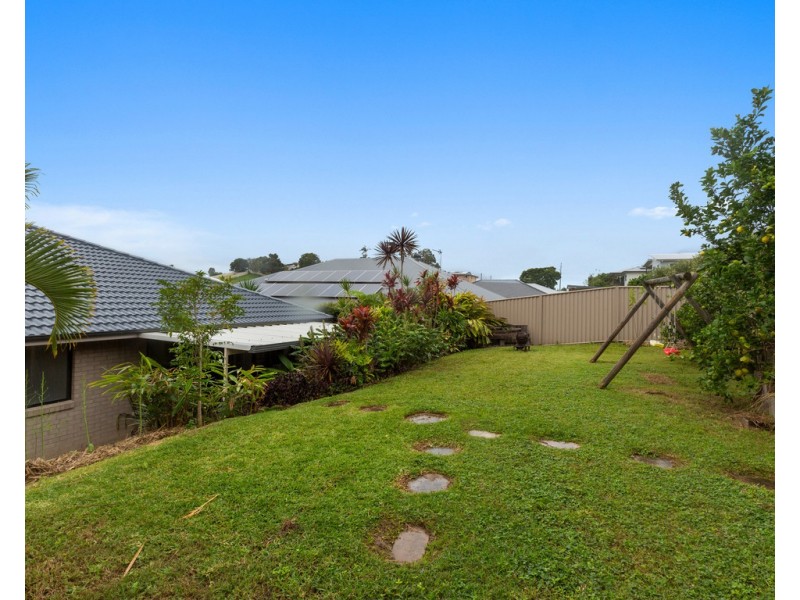
There are approximately 18,049 people living in Murwillumbah but… who are they?
44
49%
51%
Suburb Stats
$834/WK
$250/WK
$382/WK
Value of property in Murwillumbah and nearby suburbs
Murwillumbah
Brushgrove
Townsend
Ocean Shores
Average Home Price$479,070Average Rental Price$346Household Size2.5
Average Home Price$460,239Average Rental Price$327Household Size2.4
Average Home Price$374,149Average Rental Price$589Household Size2.4
Average Home Price$638,001Average Rental Price$433Household Size2.4
Water Useper year per person
0.6mln. litres
State Average 0.74 mln. litres
Nat. Average 0.74 mln. litres
Greenhouse Pollutionper year per person
16.48tonnes
State Average 19.31 tonnes
Nat. Average 20.3 tonnes
Dwelling Types
91%
5%
3%
Most Common Suburb Professions
17% Professio…
15% Technicia…
14% Managers…
12% Labourers…
Nearby schools: murwillumbah high school, mt st patrick college, murwillumbah community college, murwillumbah east primary school
Nearby cafes: auto cafe, sugar beat cafe, dabelles cafe, fish bowl cafe
Nearby doctors: king street medical centre-warne douglas, advanced radiology clinics murwillumbah, queen street medical centre, main street medical centre
Nearby hospitals: murwillumbah district hospital, queen street medical centre, king street medical centre