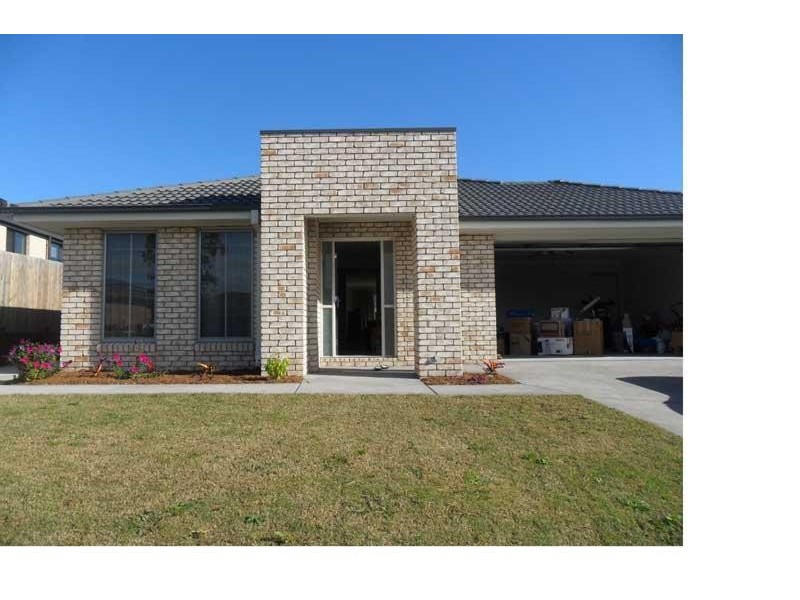
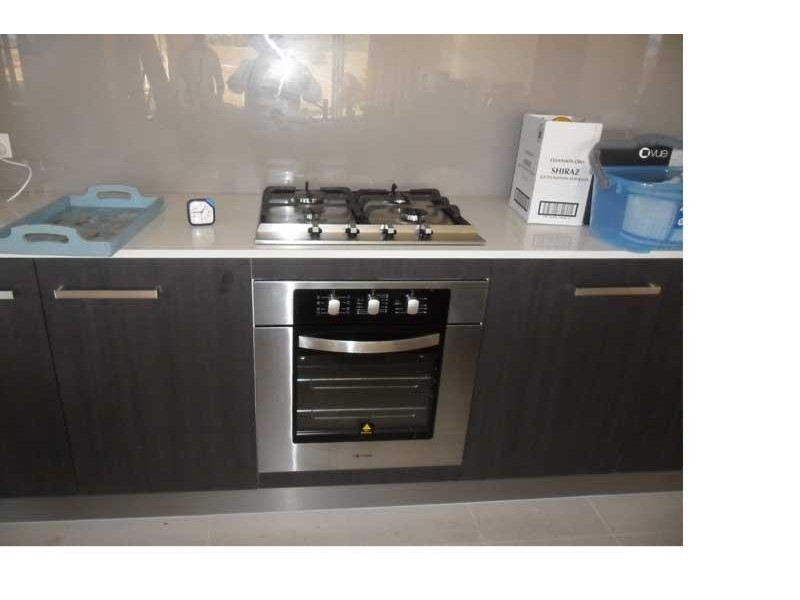
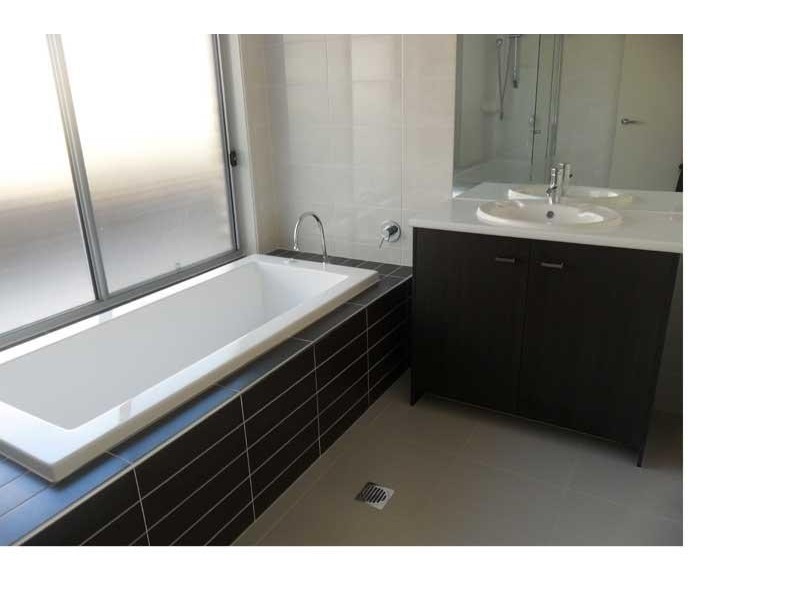
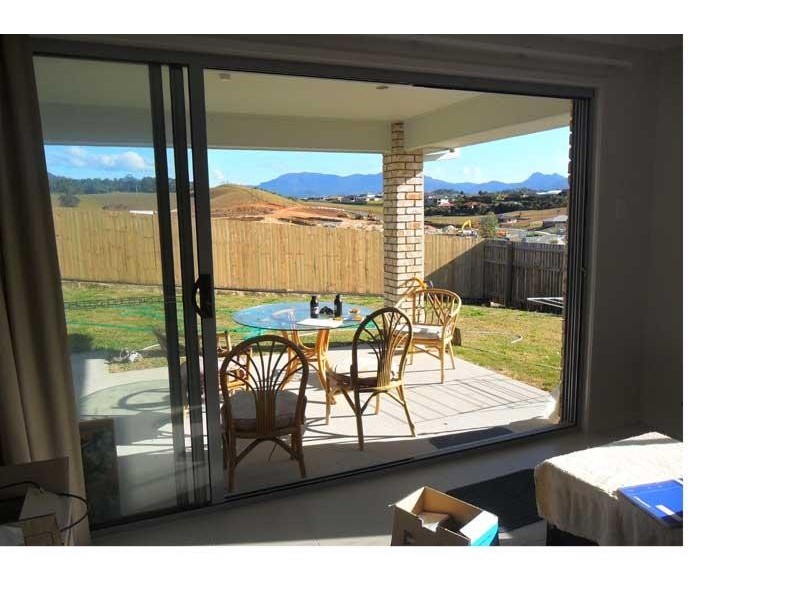
There are approximately 18,049 people living in Murwillumbah but… who are they?
44
49%
51%
Suburb Stats
$834/WK
$250/WK
$382/WK
Value of property in Murwillumbah and nearby suburbs
Murwillumbah
Grafton
Brushgrove
Cabarita Beach
Average Home Price$479,070Average Rental Price$346Household Size2.5
Average Home Price$314,959Average Rental Price$305Household Size2.4
Average Home Price$460,239Average Rental Price$327Household Size2.4
Average Home Price$532,487Average Rental Price$407Household Size2.5
Water Useper year per person
0.6mln. litres
State Average 0.74 mln. litres
Nat. Average 0.74 mln. litres
Greenhouse Pollutionper year per person
16.48tonnes
State Average 19.31 tonnes
Nat. Average 20.3 tonnes
Dwelling Types
91%
5%
3%
Most Common Suburb Professions
17% Professio…
15% Technicia…
14% Managers…
12% Labourers…
Nearby schools: murwillumbah high school, murwillumbah community college, murwillumbah east primary school, murwillumbah south infants school
Nearby cafes: dabelles cafe, auto cafe, fish bowl cafe, the blue frog
Nearby doctors: king street dental practice - dr. evans michael, martine brinsdon, main street medical centre, king street medical centre- dr. j. stephenson
Nearby hospitals: king street medical centre, queen street medical centre, murwillumbah district hospital