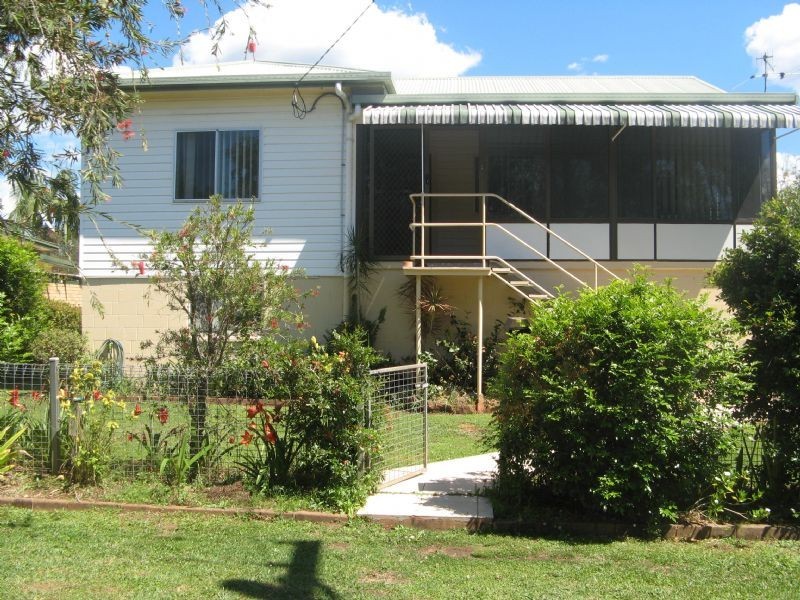
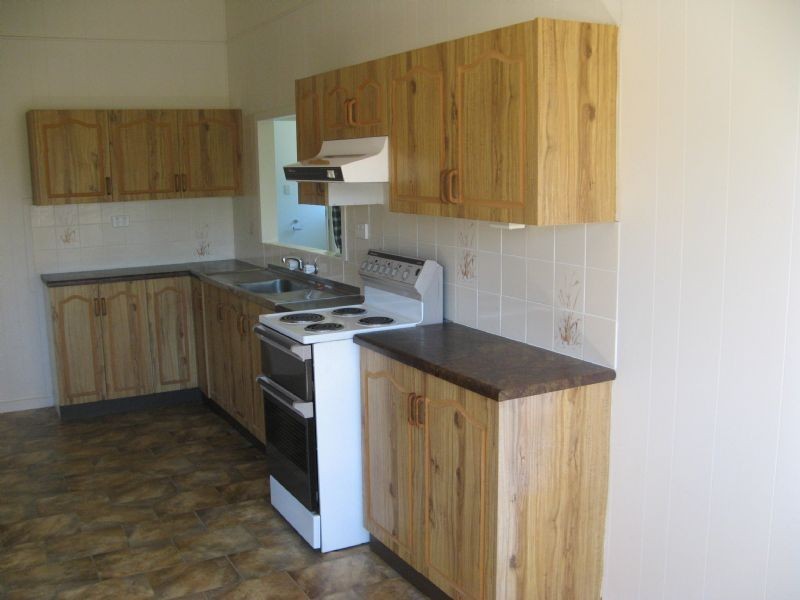
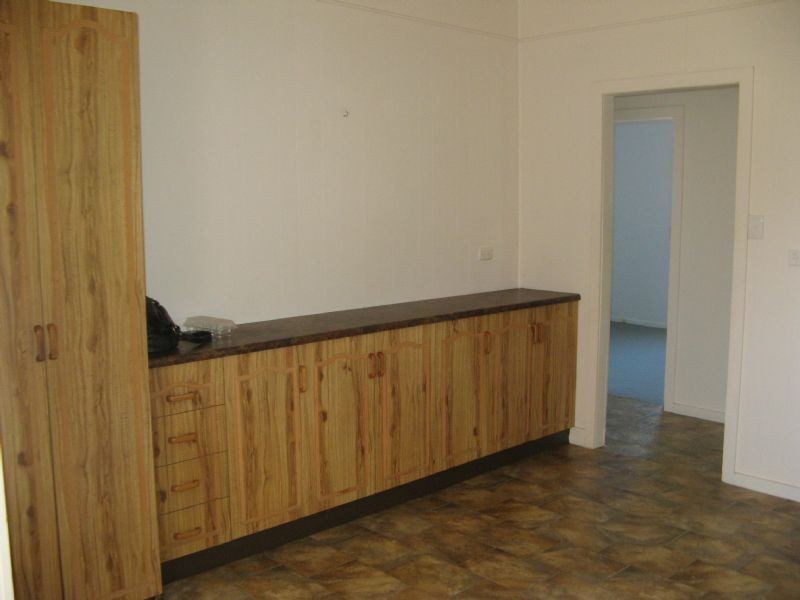
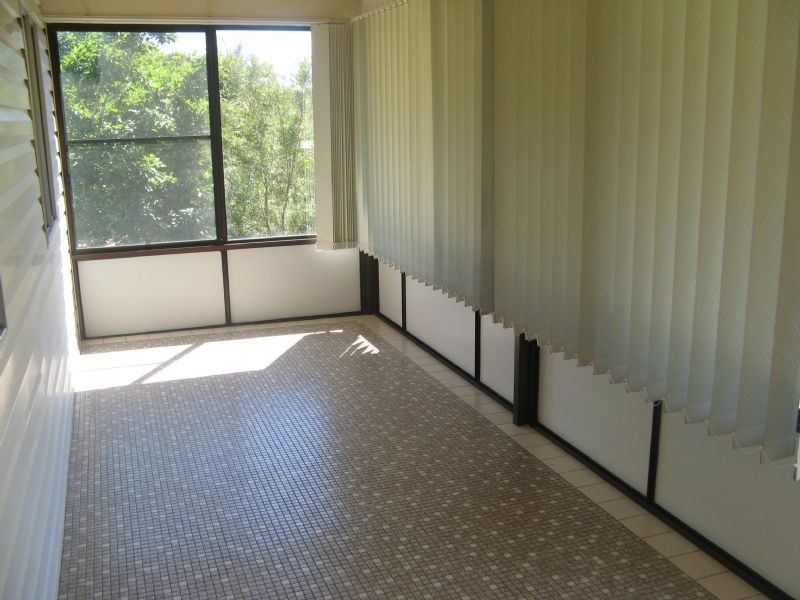
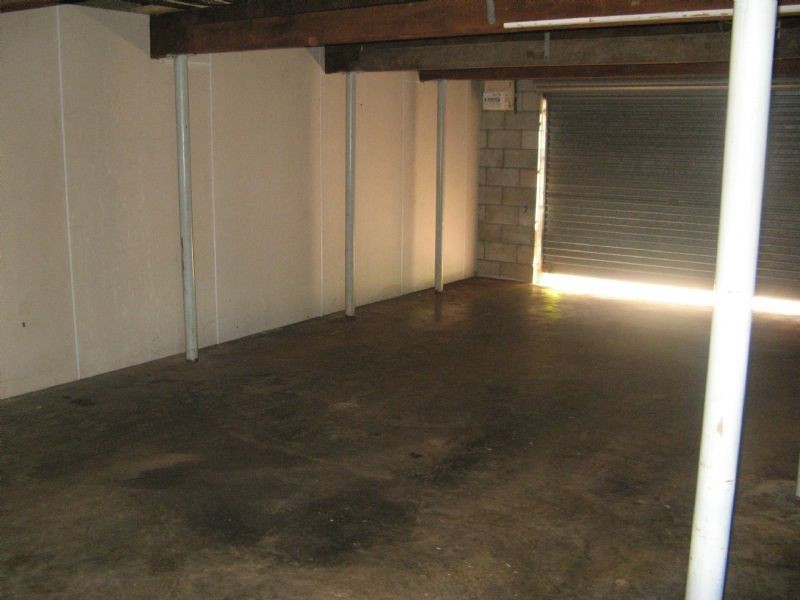
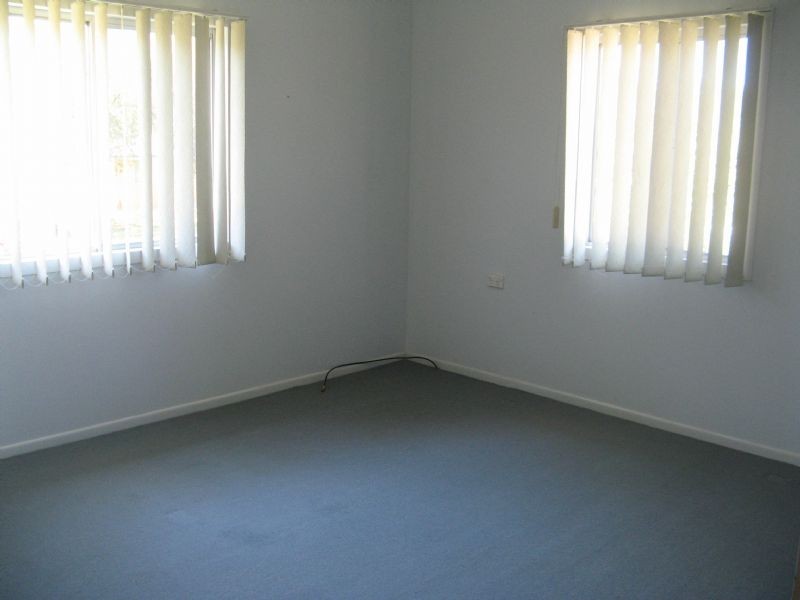
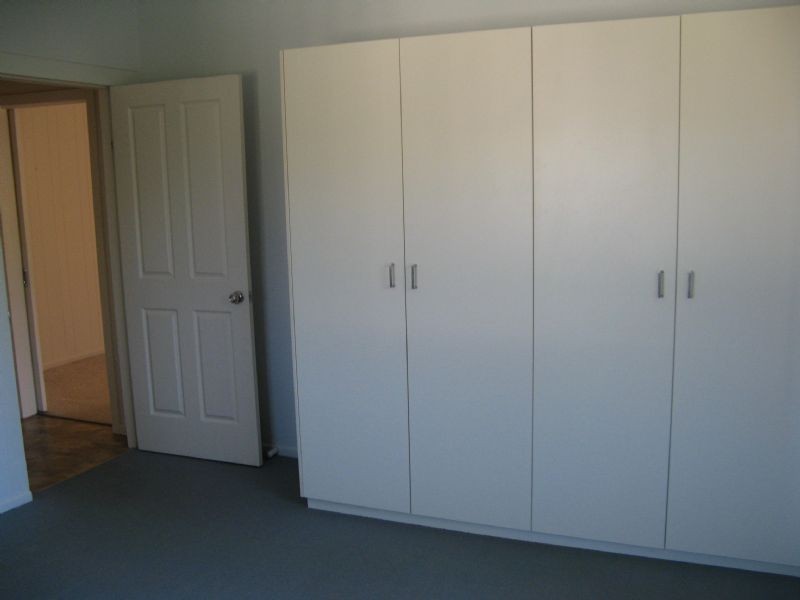
There are approximately 18,049 people living in Murwillumbah but… who are they?
44
49%
51%
Suburb Stats
$834/WK
$250/WK
$382/WK
Value of property in Murwillumbah and nearby suburbs
Murwillumbah
Chillingham
Goonellabah
Corndale
Average Home Price$479,070Average Rental Price$346Household Size2.5
Average Home Price$484,579Average Rental Price$325Household Size2.5
Average Home Price$407,924Average Rental Price$317Household Size2.4
Average Home Price$841,931Average Rental Price$405Household Size2.4
Water Useper year per person
0.6mln. litres
State Average 0.74 mln. litres
Nat. Average 0.74 mln. litres
Greenhouse Pollutionper year per person
16.48tonnes
State Average 19.31 tonnes
Nat. Average 20.3 tonnes
Dwelling Types
91%
5%
3%
Most Common Suburb Professions
17% Professio…
15% Technicia…
14% Managers…
12% Labourers…
Nearby schools: murwillumbah community college, murwillumbah east primary school, mt st patrick college, murwillumbah south infants school
Nearby cafes: king street cafe, auto cafe, fish bowl cafe, sugar beat cafe
Nearby doctors: dr rafael maia, king street medical centre-warne douglas, advanced radiology clinics murwillumbah, king street medical centre-dr yabsley robyn
Nearby hospitals: queen street medical centre, murwillumbah district hospital, king street medical centre