Listing ID: 37895003
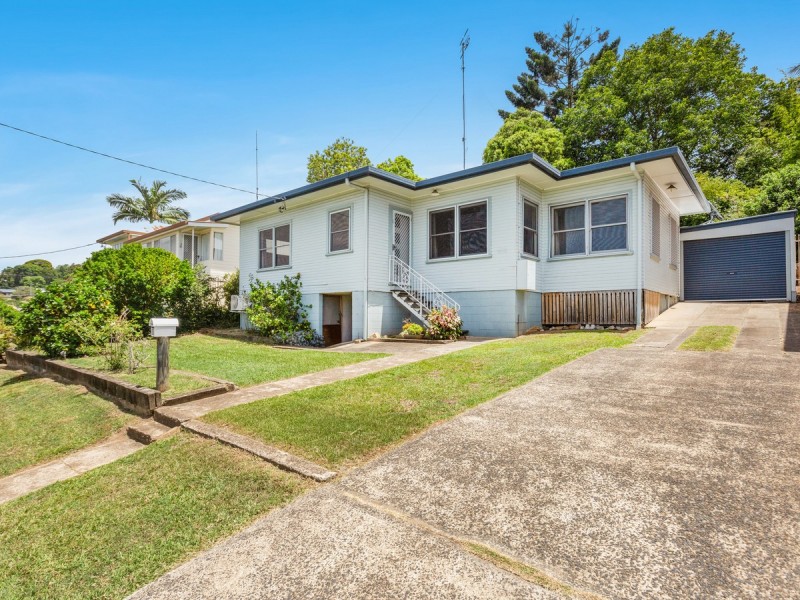
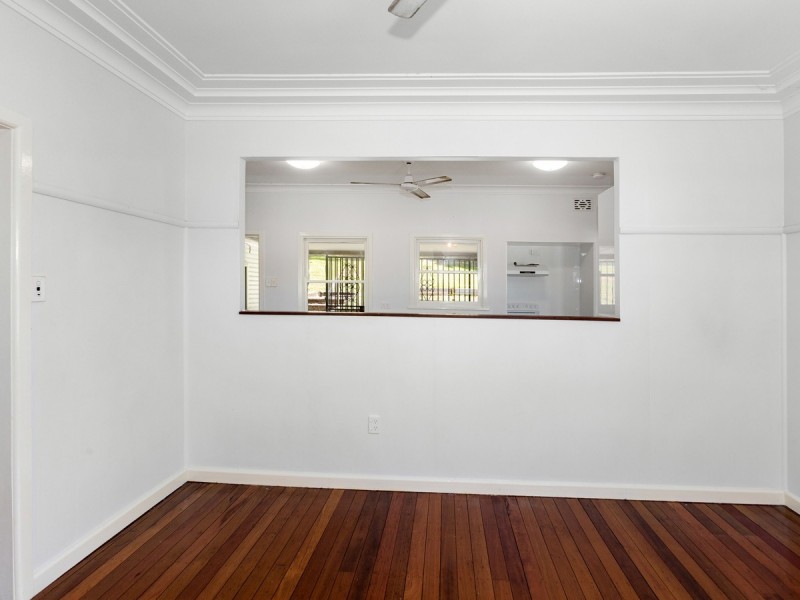
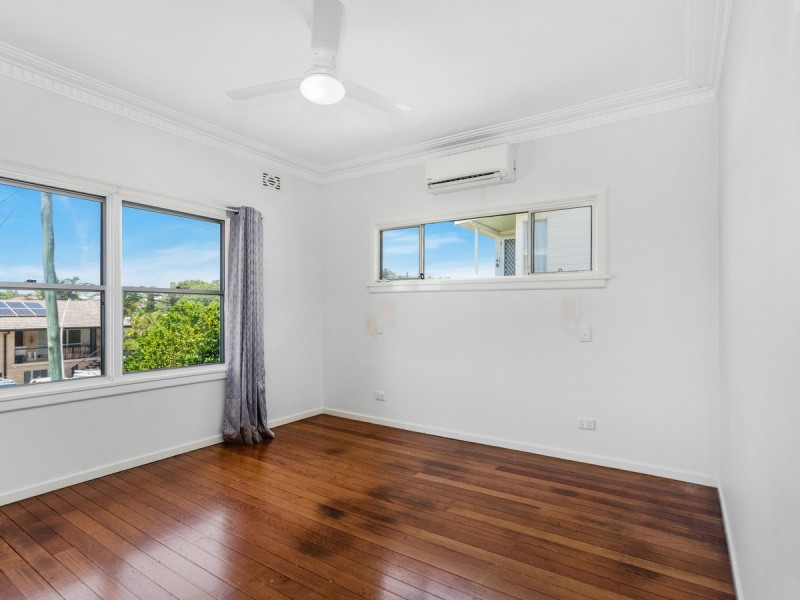
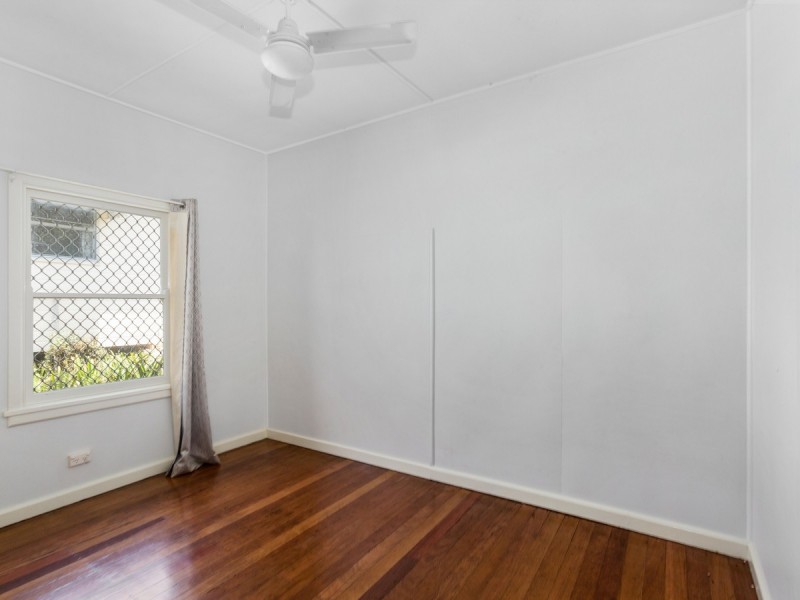
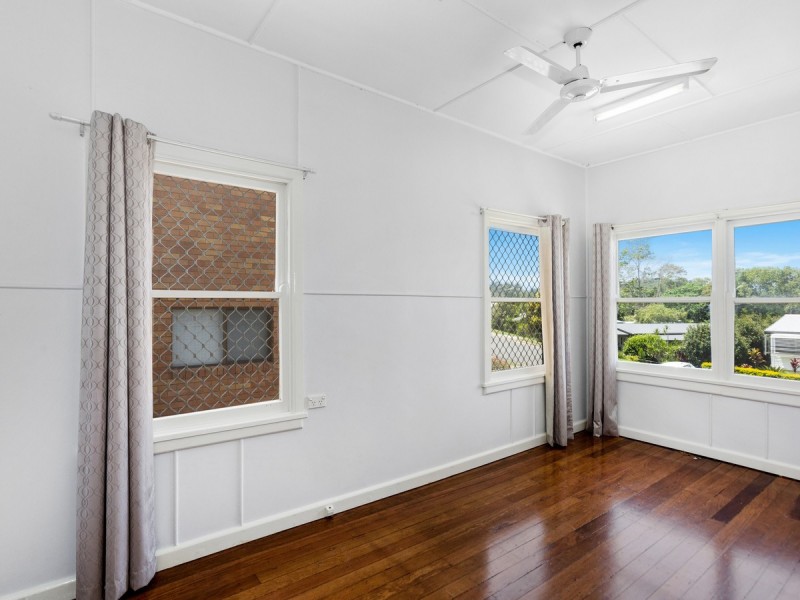
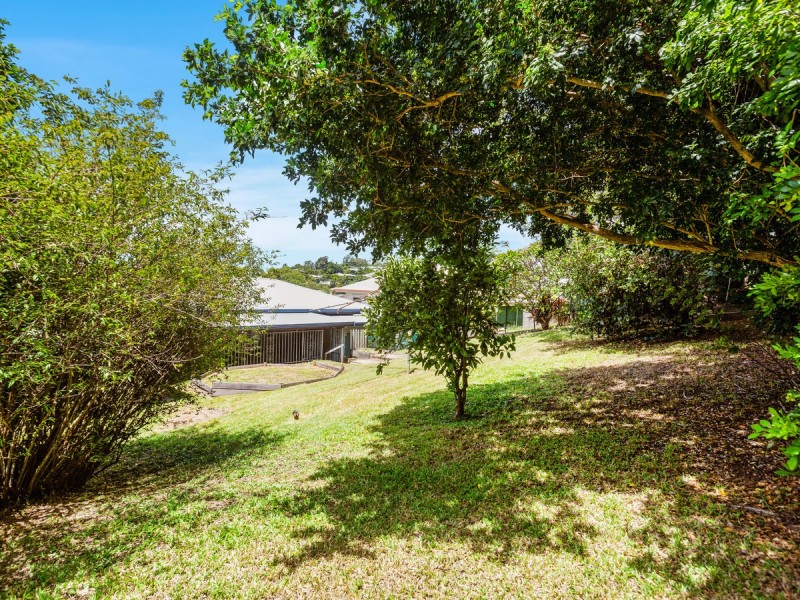
23 Dorothy Street, Murwillumbah NSW 2484
Awaiting its new owner
$440 p/w
- Listing history:
- 14 Aug, 2013
- 10 Oct, 2016
- 14 Feb, 2019
- 5 Apr, 2019

- 3
- 1
- 1
Awaiting its new owner


Listing ID: 37895003