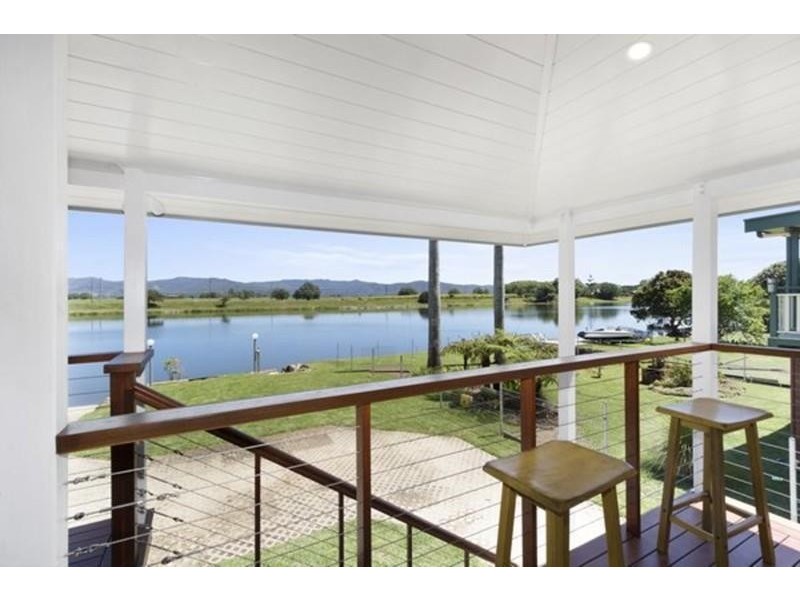
There are approximately 18,049 people living in Murwillumbah but… who are they?
44
49%
51%
Suburb Stats
$834/WK
$250/WK
$382/WK
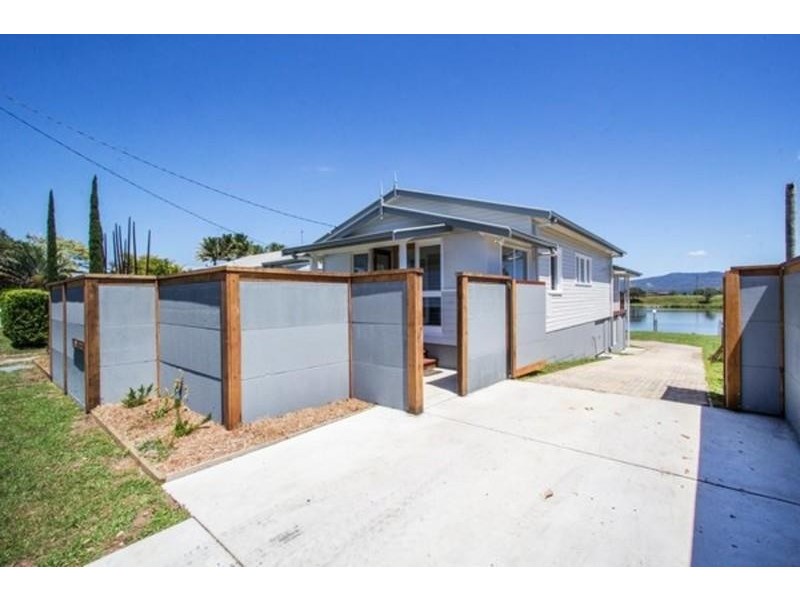
Value of property in Murwillumbah and nearby suburbs
Murwillumbah
Wells Crossing
Iluka
Tweed Heads South
Average Home Price$479,070Average Rental Price$346Household Size2.5
Average Home Price$421,857Average Rental Price$369Household Size2.4
Average Home Price$442,348Average Rental Price$340Household Size2
Average Home Price$426,767Average Rental Price$371Household Size2.4
Water Useper year per person
0.6mln. litres
State Average 0.74 mln. litres
Nat. Average 0.74 mln. litres
Greenhouse Pollutionper year per person
16.48tonnes
State Average 19.31 tonnes
Nat. Average 20.3 tonnes
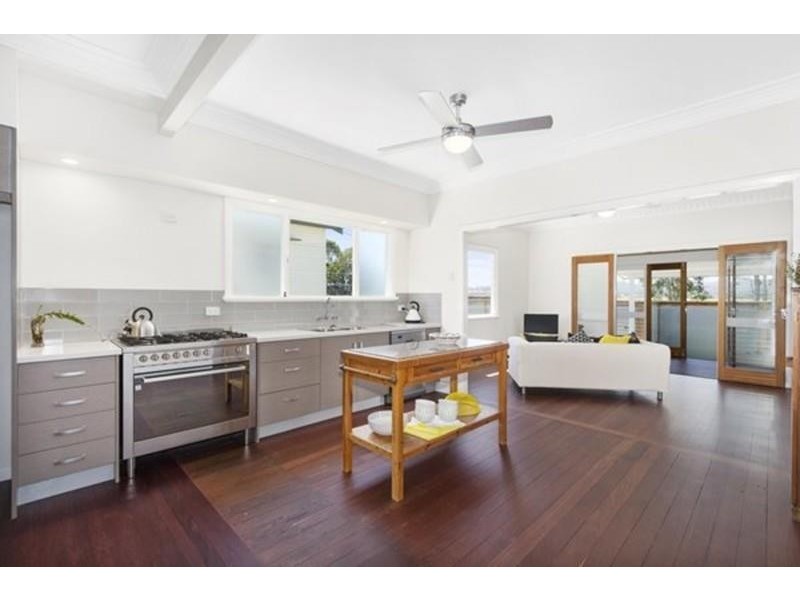
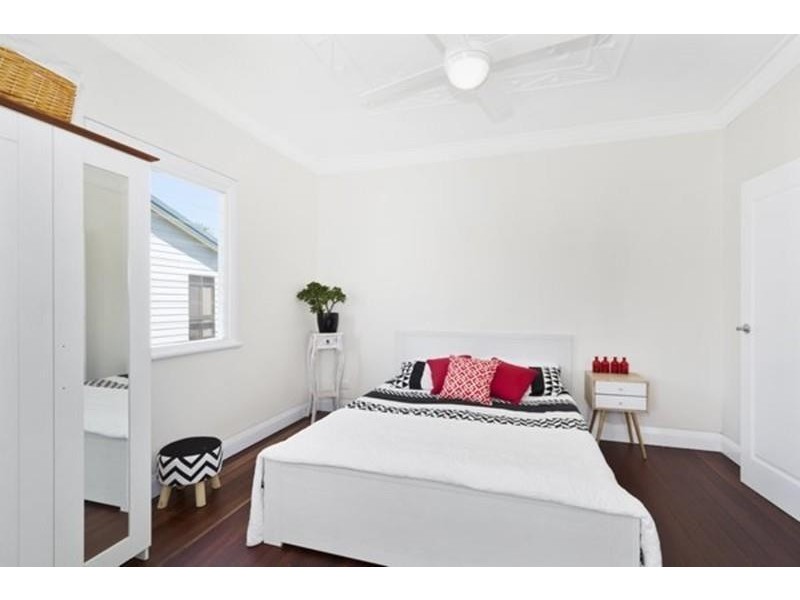
Dwelling Types
91%
5%
3%
Most Common Suburb Professions
17% Professio…
15% Technicia…
14% Managers…
12% Labourers…
Nearby schools: murwillumbah east primary school, murwillumbah south infants school, murwillumbah high school, mt st patrick college
Nearby cafes: fish bowl cafe, auto cafe, the modern grocer, cenzo cafe
Nearby doctors: king street medical centre-dr yabsley robyn, kettle i h, king street medical centre-dr alan secombe, king street dental practice - dr. evans michael
Nearby hospitals: murwillumbah district hospital, king street medical centre, queen street medical centre