There are approximately 18,049 people living in Murwillumbah but… who are they?
44
49%
51%
Suburb Stats
$834/WK
$250/WK
$382/WK
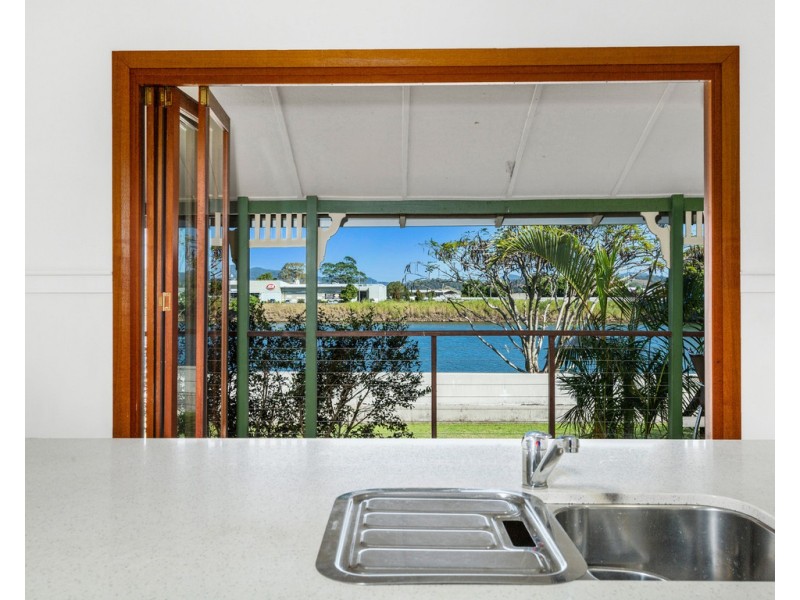
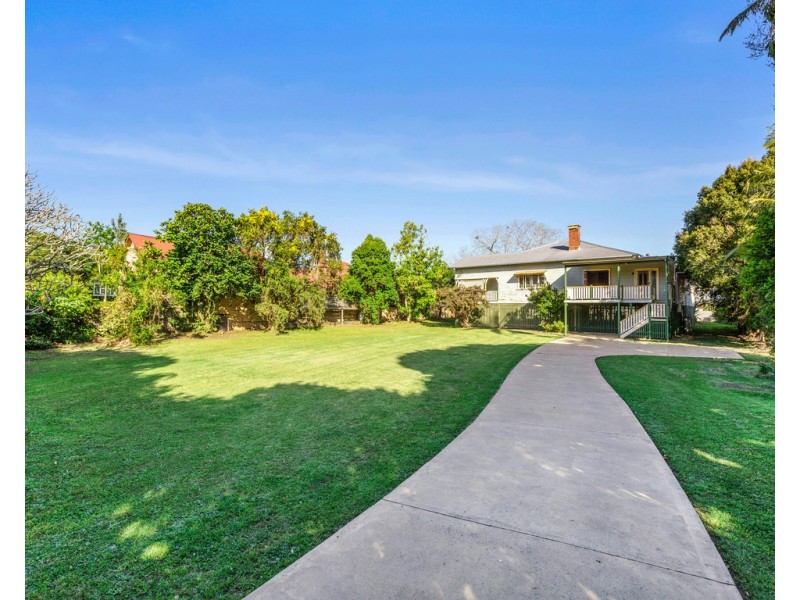
Value of property in Murwillumbah and nearby suburbs
Murwillumbah
Tumbulgum
Grafton
Nimbin
Average Home Price$479,070Average Rental Price$346Household Size2.5
Average Home Price$547,085Average Rental Price$442Household Size2.7
Average Home Price$314,959Average Rental Price$305Household Size2.4
Average Home Price$463,353Average Rental Price$314Household Size2.4
Water Useper year per person
0.6mln. litres
State Average 0.74 mln. litres
Nat. Average 0.74 mln. litres
Greenhouse Pollutionper year per person
16.48tonnes
State Average 19.31 tonnes
Nat. Average 20.3 tonnes
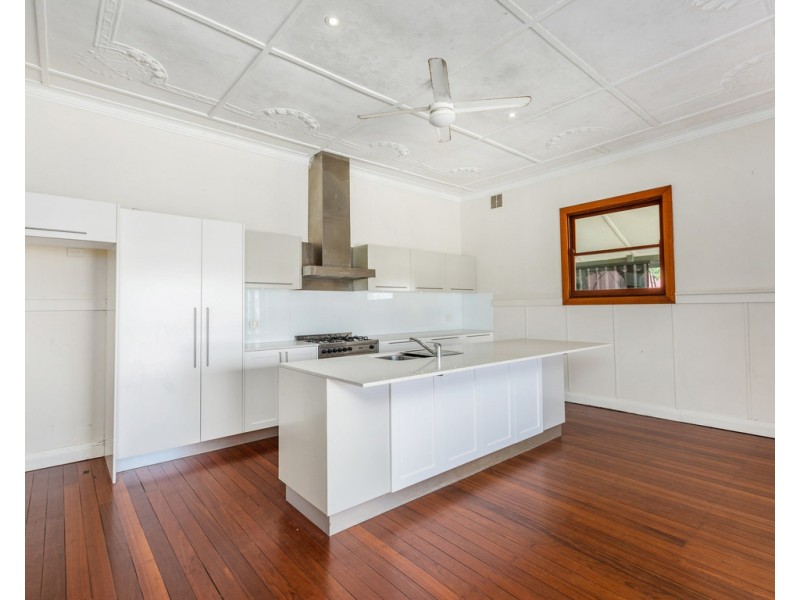
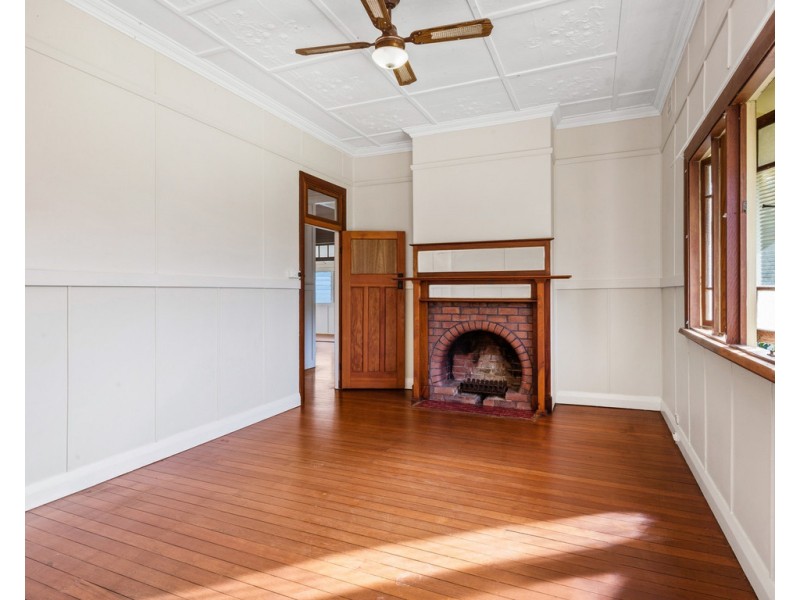
Dwelling Types
91%
5%
3%
Most Common Suburb Professions
17% Professio…
15% Technicia…
14% Managers…
12% Labourers…
Nearby schools: murwillumbah high school, murwillumbah south infants school, murwillumbah community college, murwillumbah east primary school
Nearby cafes: king street cafe, fish bowl cafe, the blue frog, the modern grocer
Nearby doctors: snedden d a, king street medical centre-warne douglas, king street medical centre- dr. j. stephenson, king street medical centre-dr john moran
Nearby hospitals: murwillumbah district hospital, queen street medical centre, king street medical centre