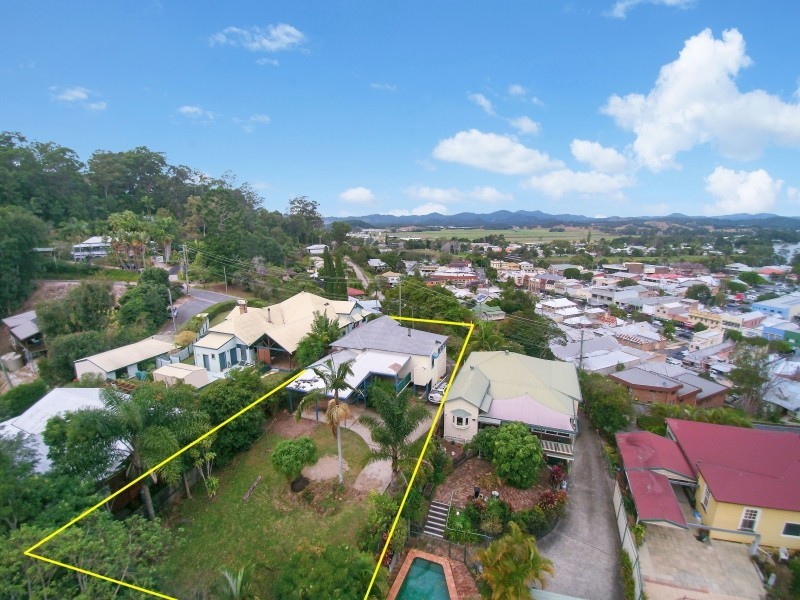
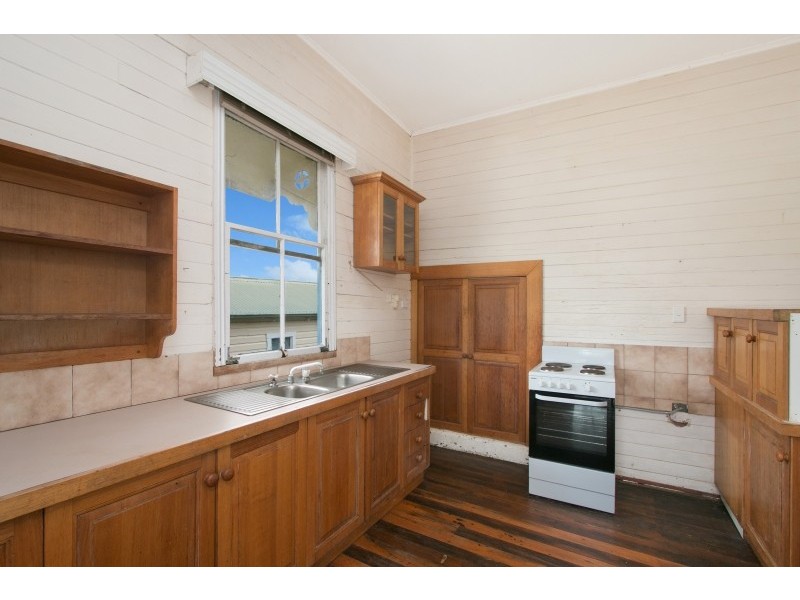
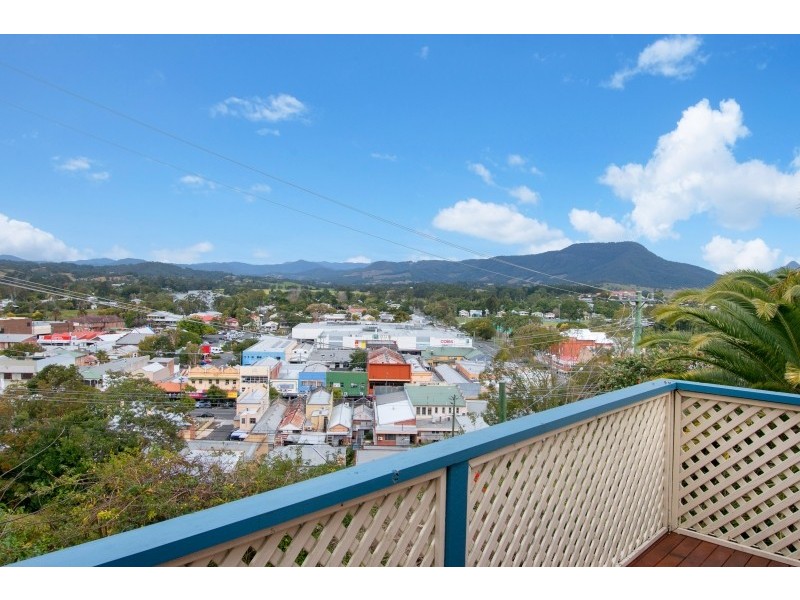
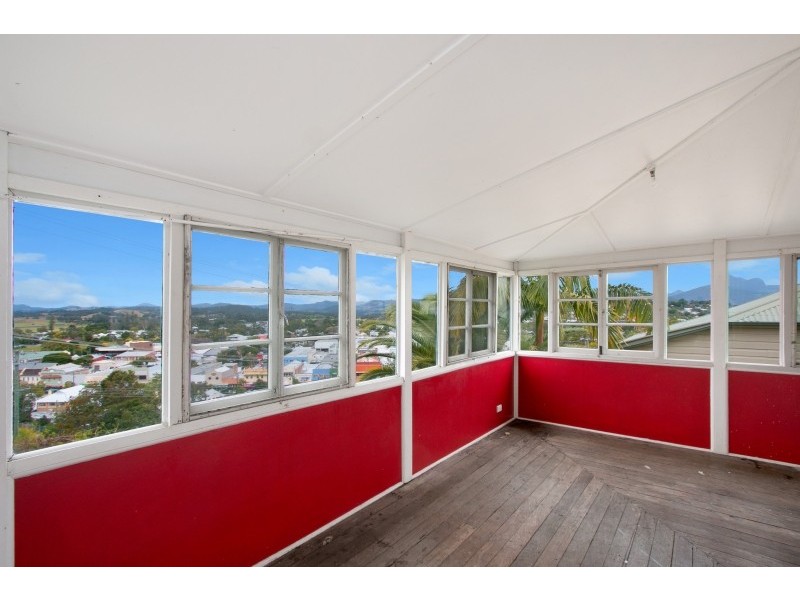
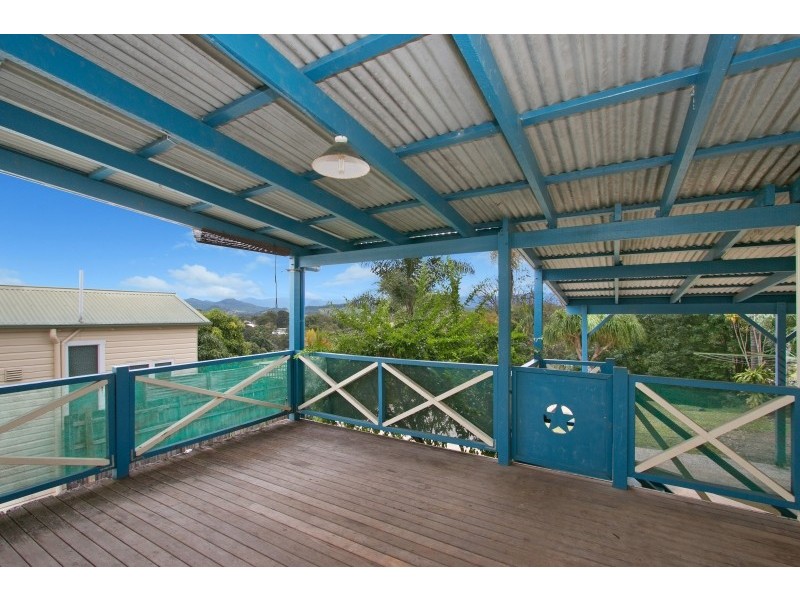
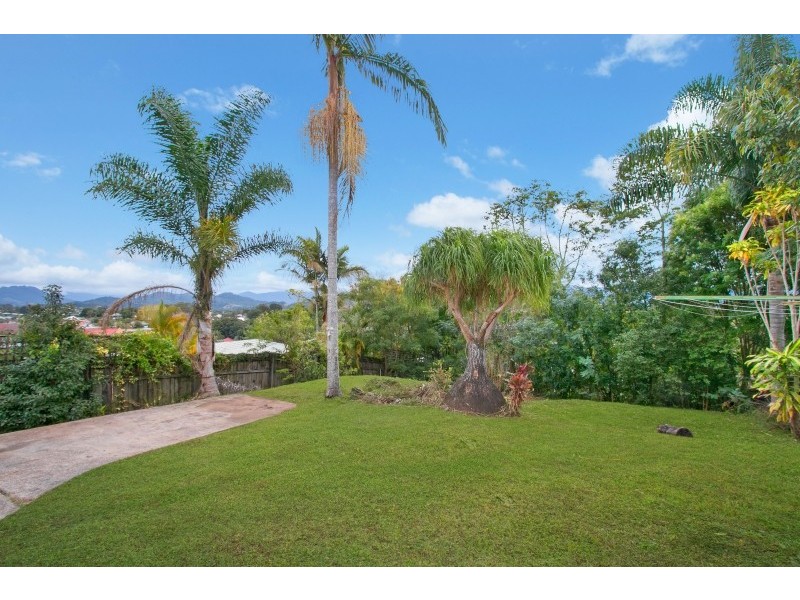
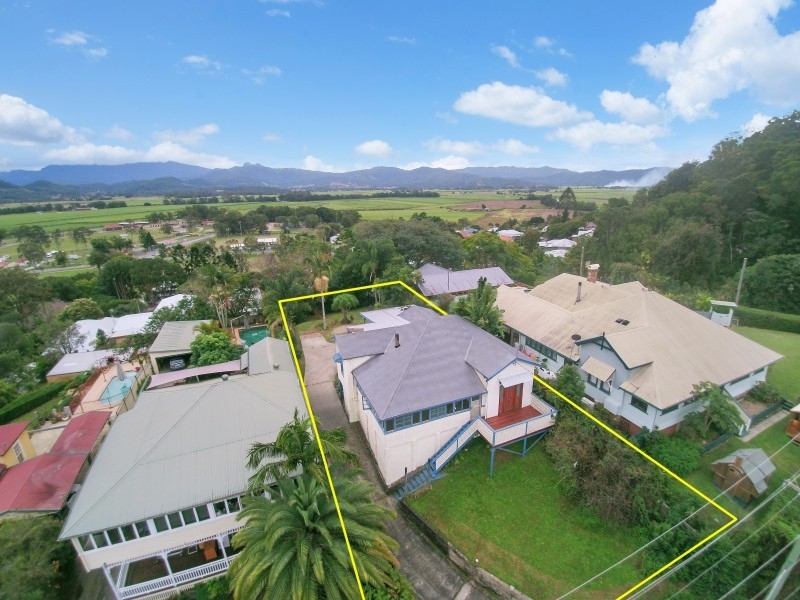
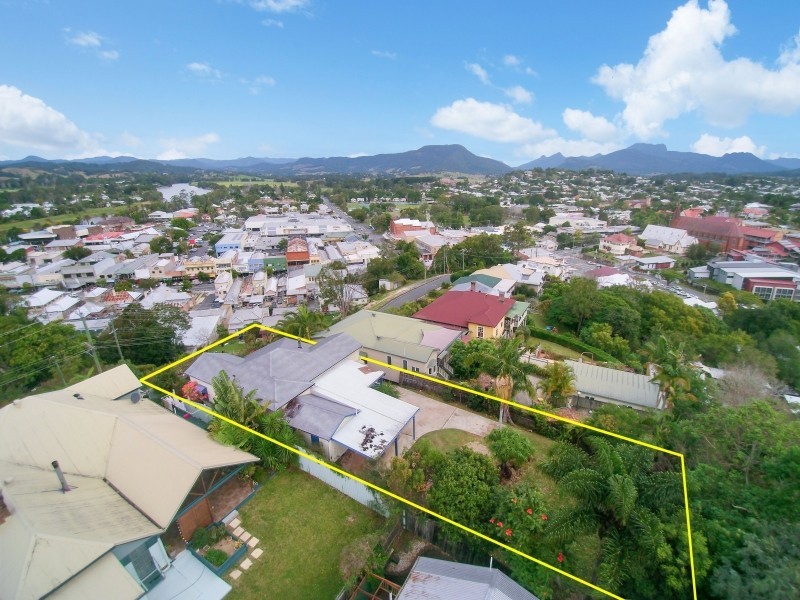
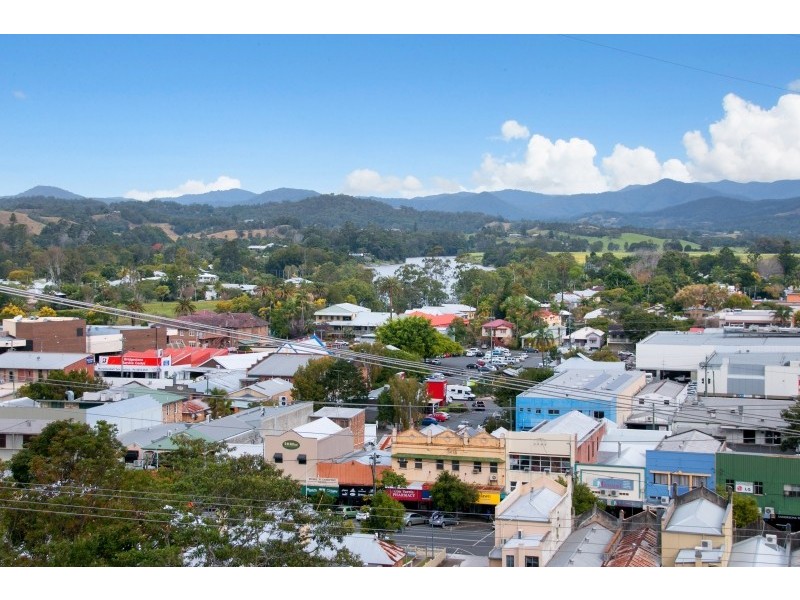
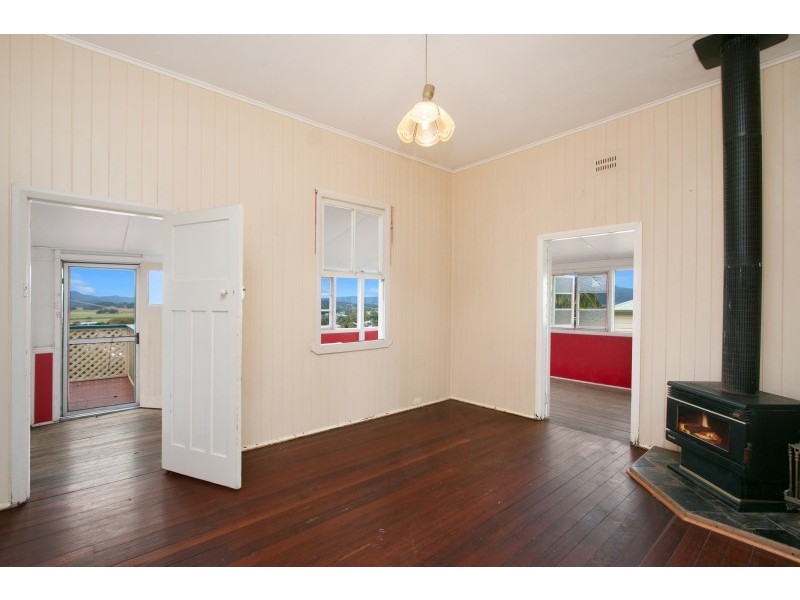
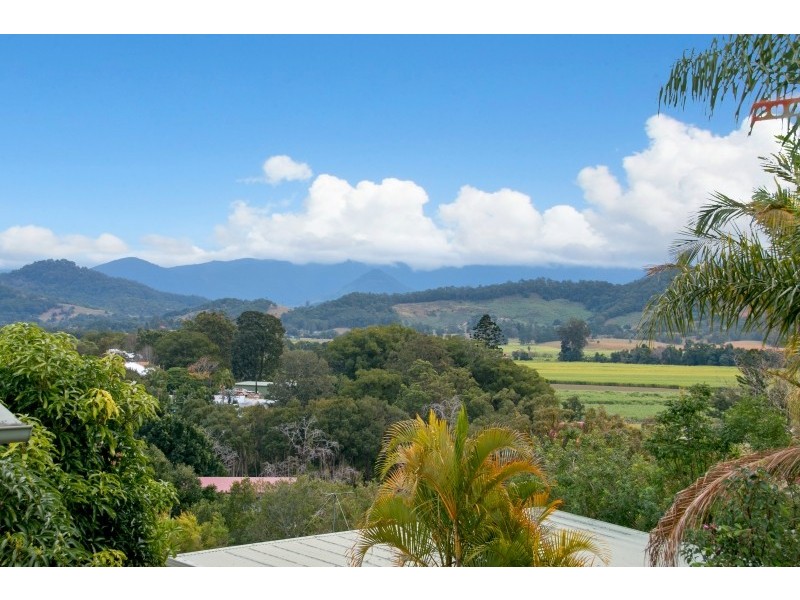
17 Bent Street, Murwillumbah NSW 2484 Great Location With Views $350 Listing history: 21 Jul, 2016 11 Oct, 2016 3 1 1 Listing ID: 32523963 Other properties to rent near 17 Bent Street, Murwillumbah NSW 2484 34 EWING STREET, Murwillumbah NSW 2484 Location THIS PROPERTY WAS LEASED Enquiry about this property Name* Email* Phone* Message* Send me regular newsletters from Homehound Have agents get in touch about similar properties within the area What is 8 + 20?* Receive email alerts for properties like this Email alerts Email* Send me regular newsletters from Homehound. Have agents get in touch about similar properties within the area What is 8 + 20?*