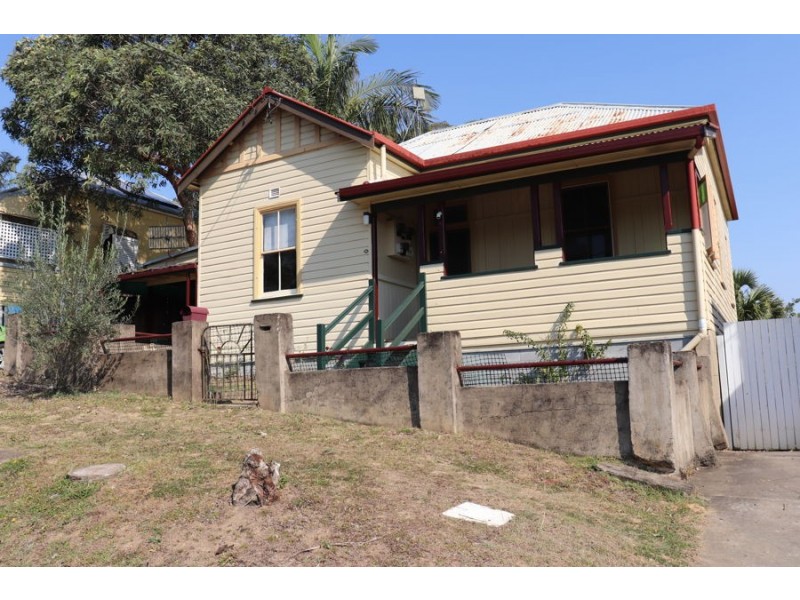
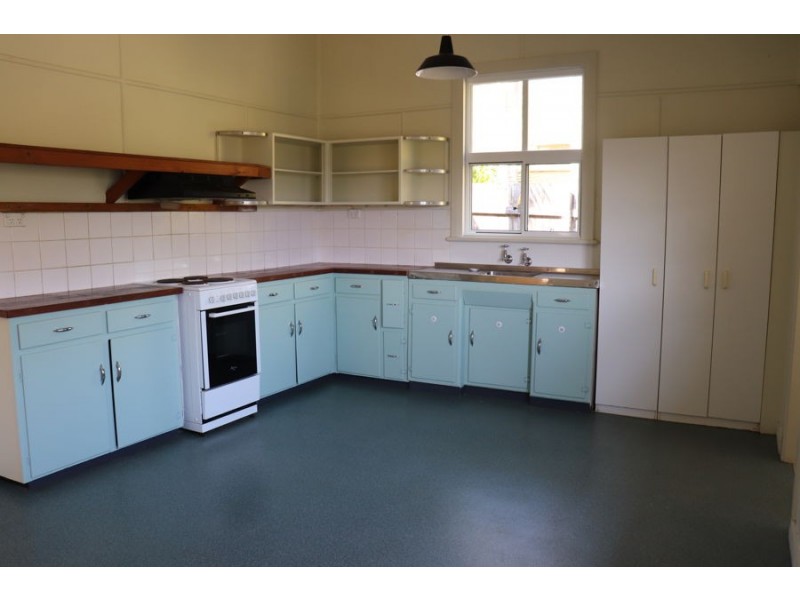
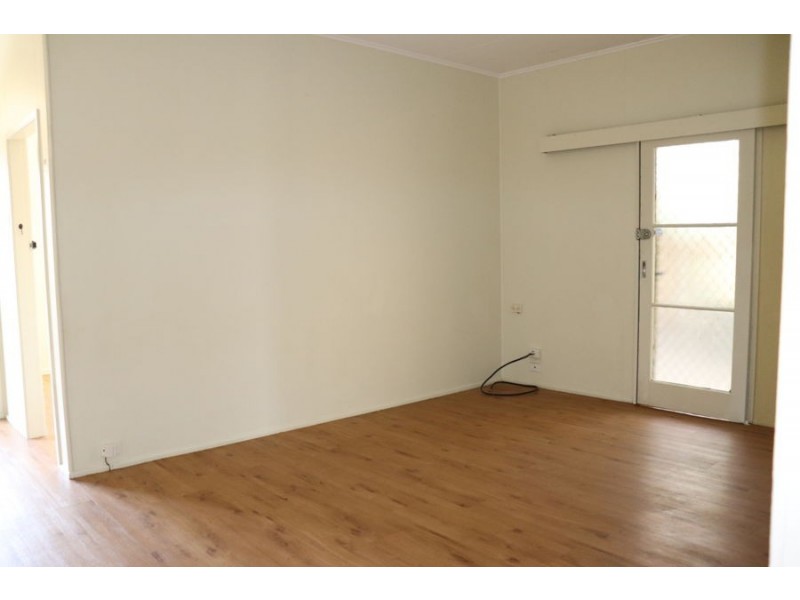
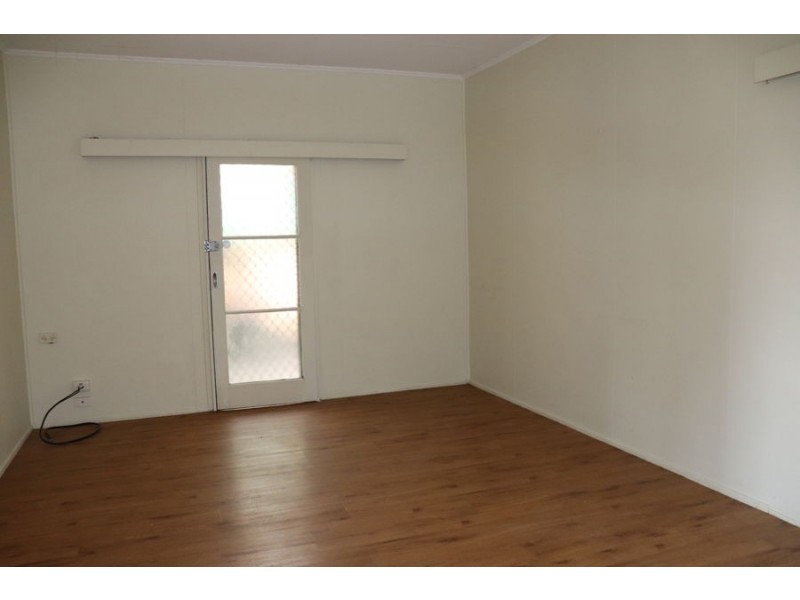
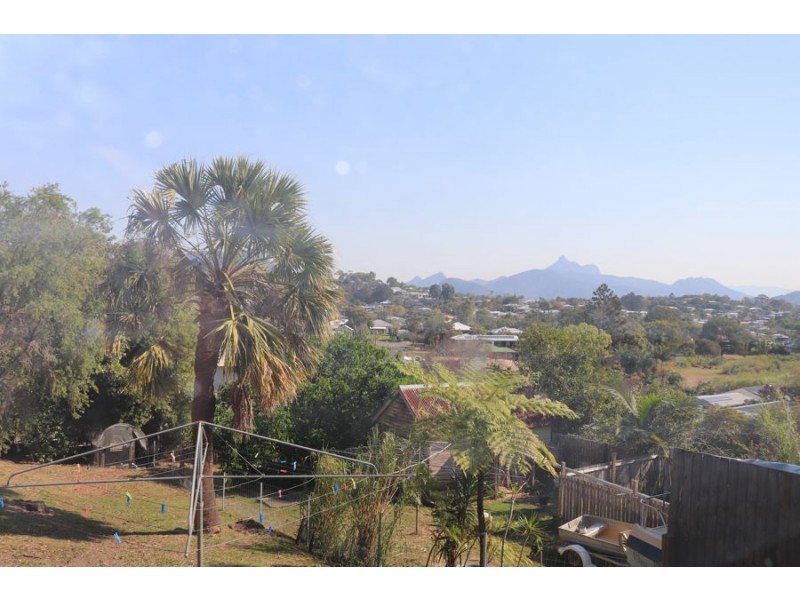
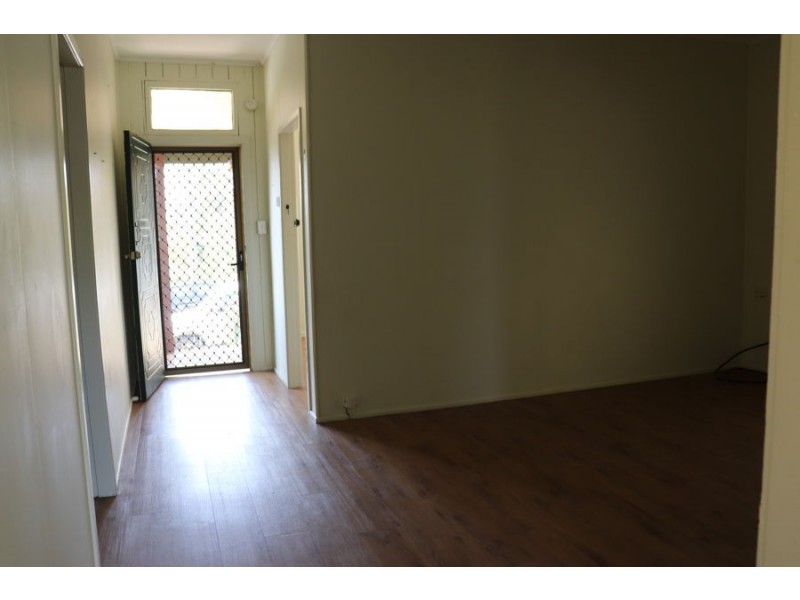
166 Murwillumbah Street, Murwillumbah NSW 2484 Walk To The Town Centre $390 Weekly Listing history: 13 Sep, 2019 26 Aug, 2024 3 1 1 Listing ID: 38541783 Other properties to rent near 166 Murwillumbah Street, Murwillumbah NSW 2484 196 Murwillumbah Street, Murwillumbah NSW 2484 196 Murwillumbah Street, Murwillumbah NSW 2484 2/1 Frances Street, Murwillumbah NSW 2484 11 Reynolds Street, Murwillumbah NSW 2484 4/32 George Street, Murwillumbah NSW 2484 Location THIS PROPERTY WAS LEASED Enquiry about this property Name* Email* Phone* Message* Send me regular newsletters from Homehound Have agents get in touch about similar properties within the area What is 8 + 20?* Receive email alerts for properties like this Email alerts Email* Send me regular newsletters from Homehound. Have agents get in touch about similar properties within the area What is 8 + 20?*