Listing ID: 32751373
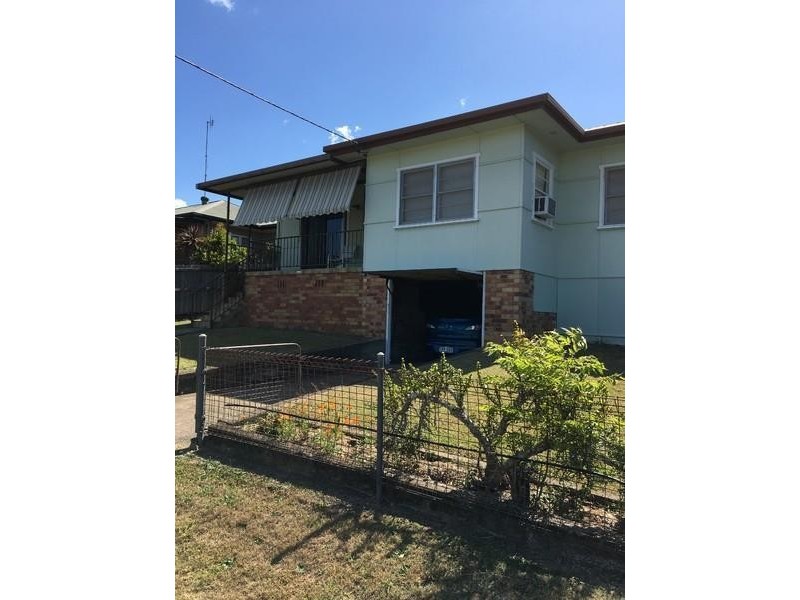
15 York Street, Murwillumbah NSW 2484
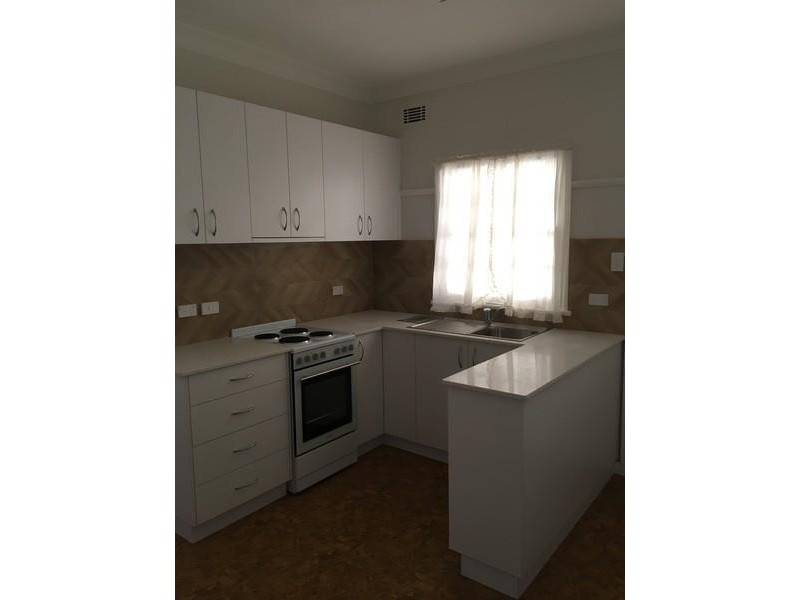
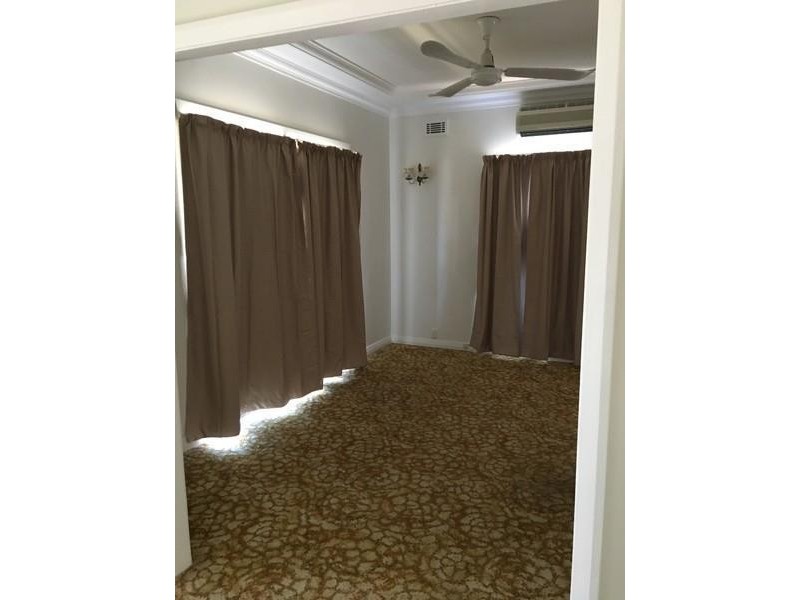
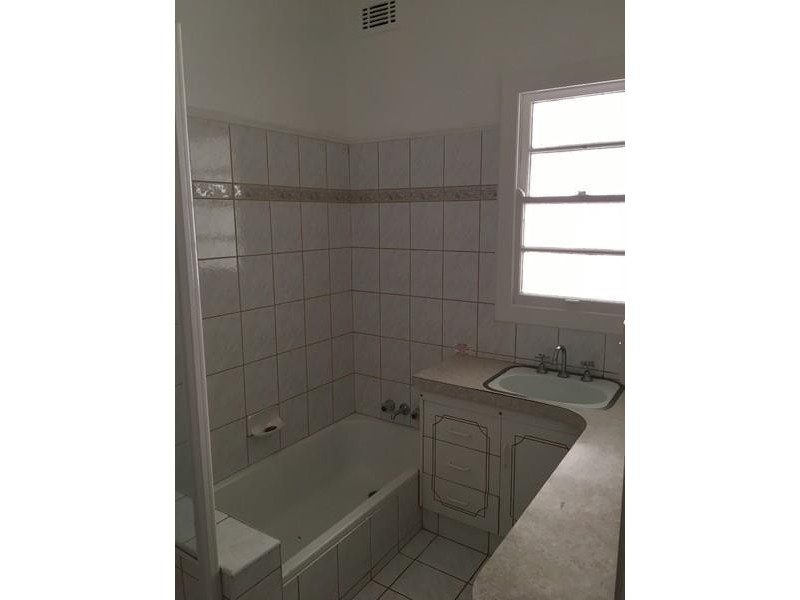
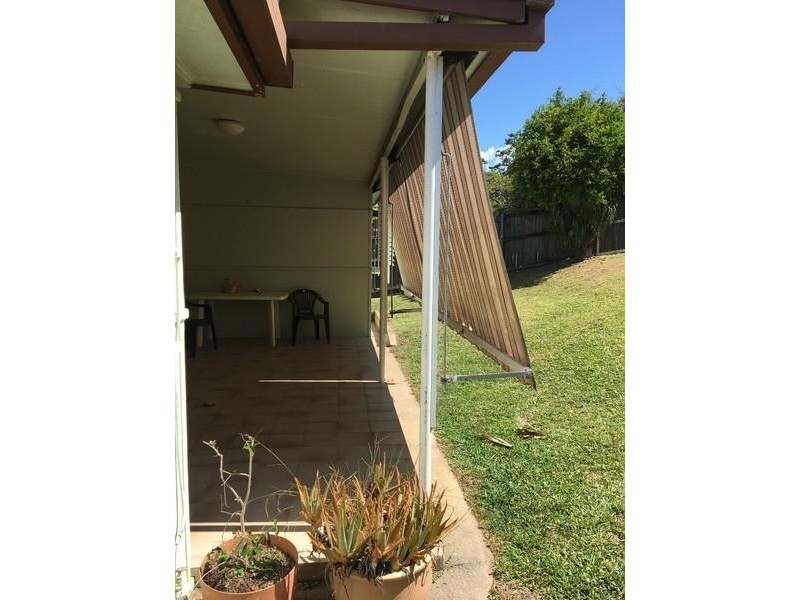
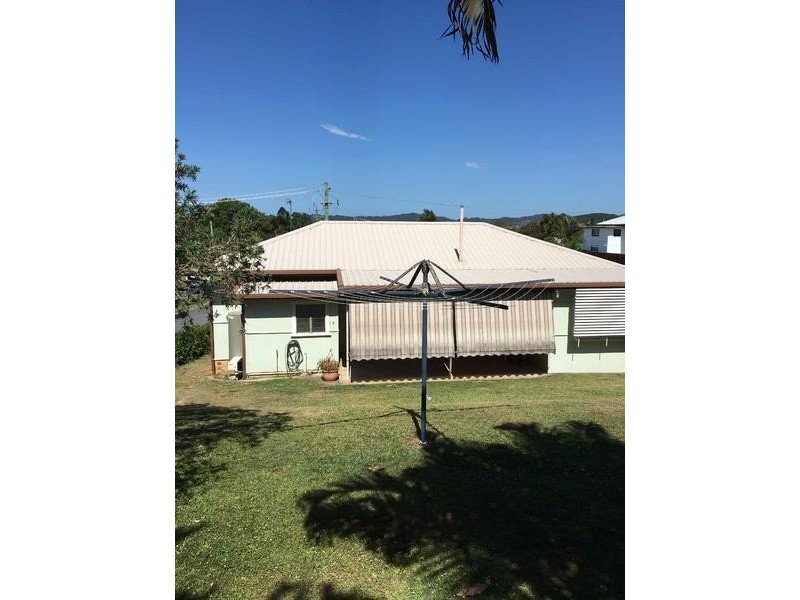
4 bedrooms close to town
$400.00 per week
- Listing history:
- 6 Jun, 2012
- 5 Jul, 2012
- 3 Aug, 2012
- 7 Nov, 2016
- 8 Feb, 2018

- 4
- 1
- 1
4 bedrooms close to town


Listing ID: 32751373