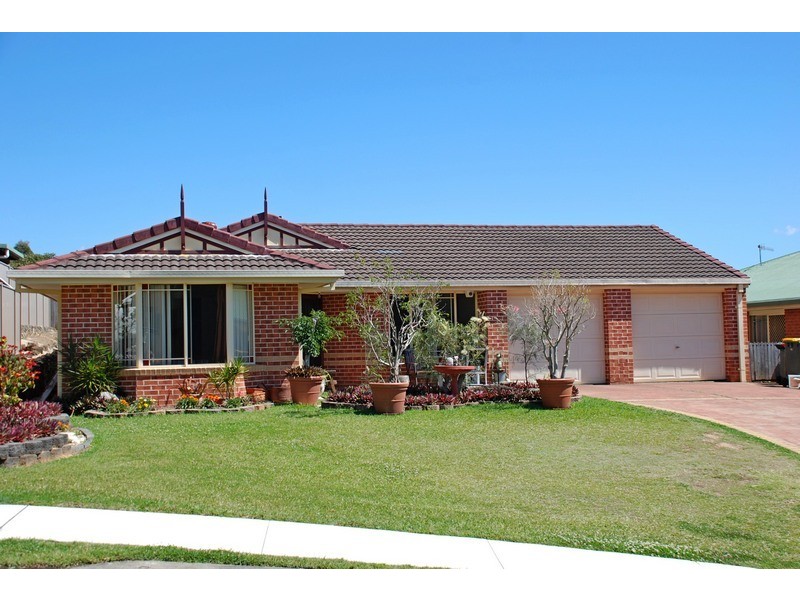
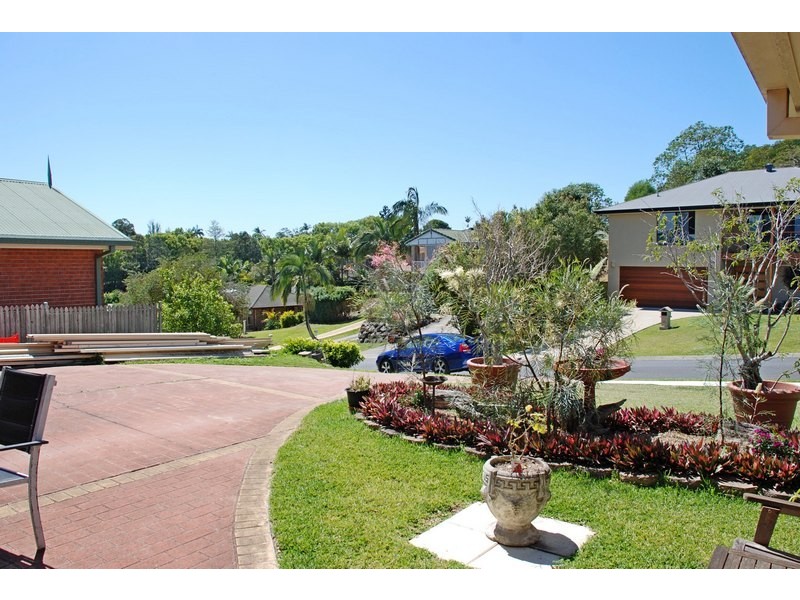
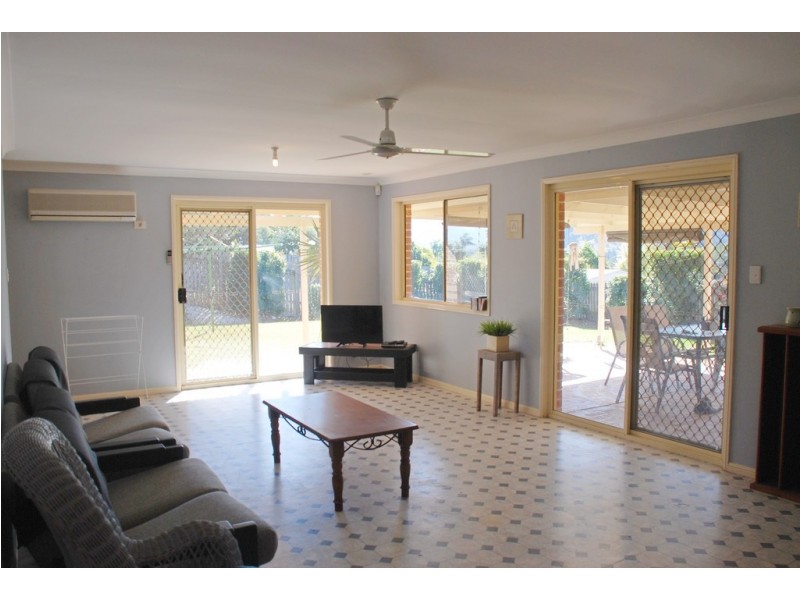
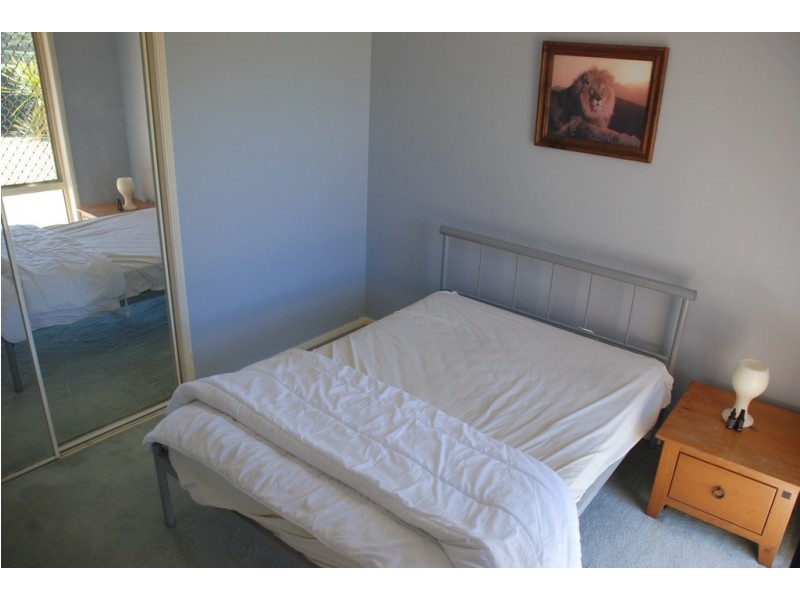
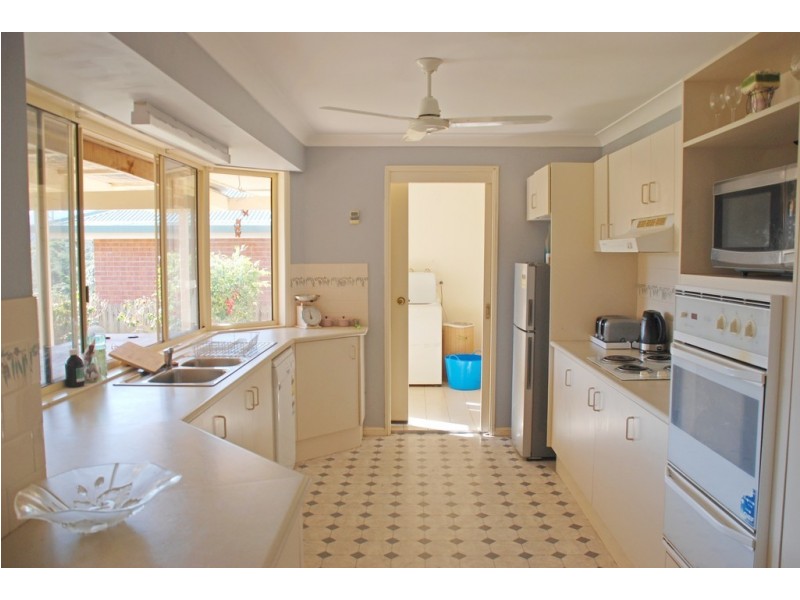
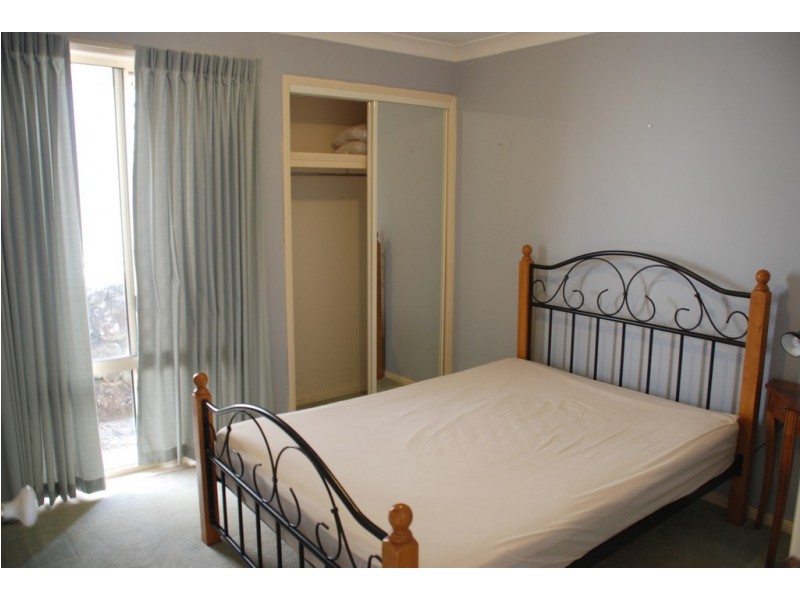
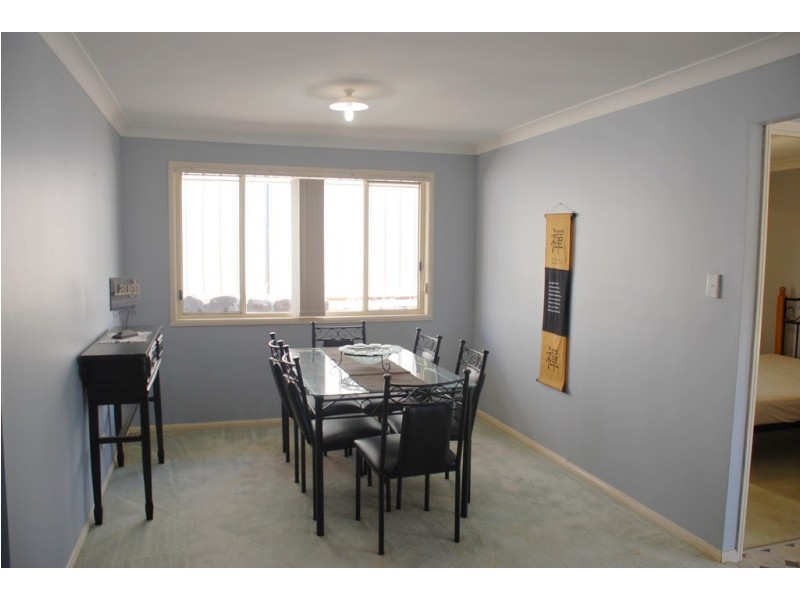
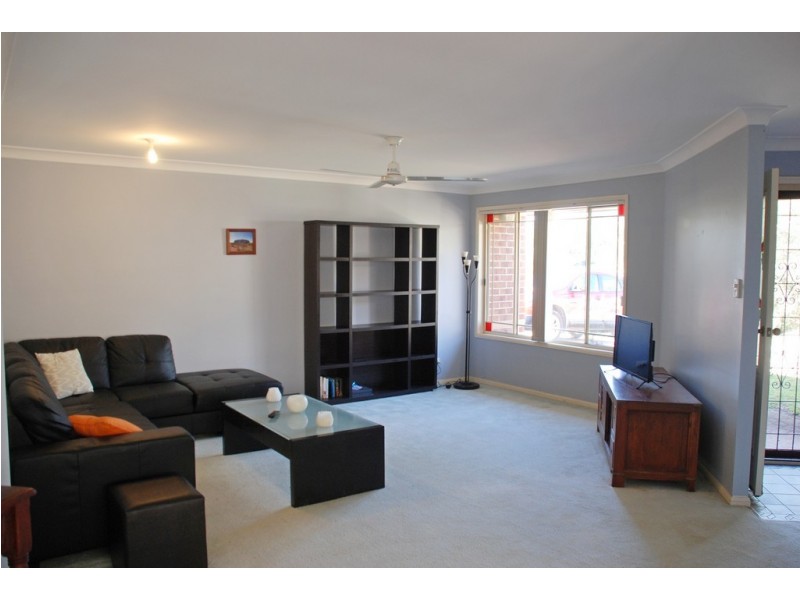
11 Castlefield Drive, Murwillumbah NSW 2484 PENDING APPLICATIONS $500 Listing history: 18 Aug, 2017 4 2 2 Listing ID: 34644128 Other properties to rent near 11 Castlefield Drive, Murwillumbah NSW 2484 66 Castle Field Drive, Murwillumbah NSW 2484 55 Castle Field Drive, Murwillumbah NSW 2484 1/18 Castlefield Drive, Murwillumbah NSW 2484 Location THIS PROPERTY WAS LEASED Enquiry about this property Name* Email* Phone* Message* Send me regular newsletters from Homehound Have agents get in touch about similar properties within the area What is 8 + 20?* Receive email alerts for properties like this Email alerts Email* Send me regular newsletters from Homehound. Have agents get in touch about similar properties within the area What is 8 + 20?*