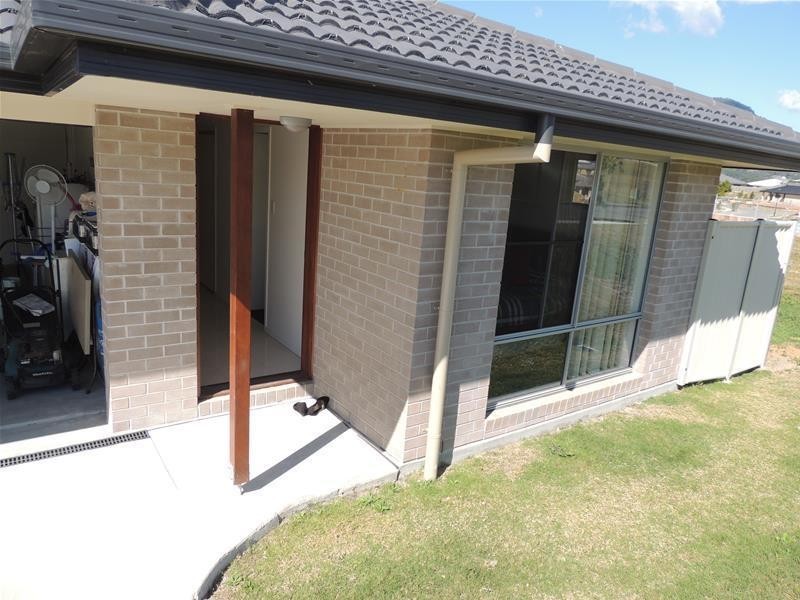
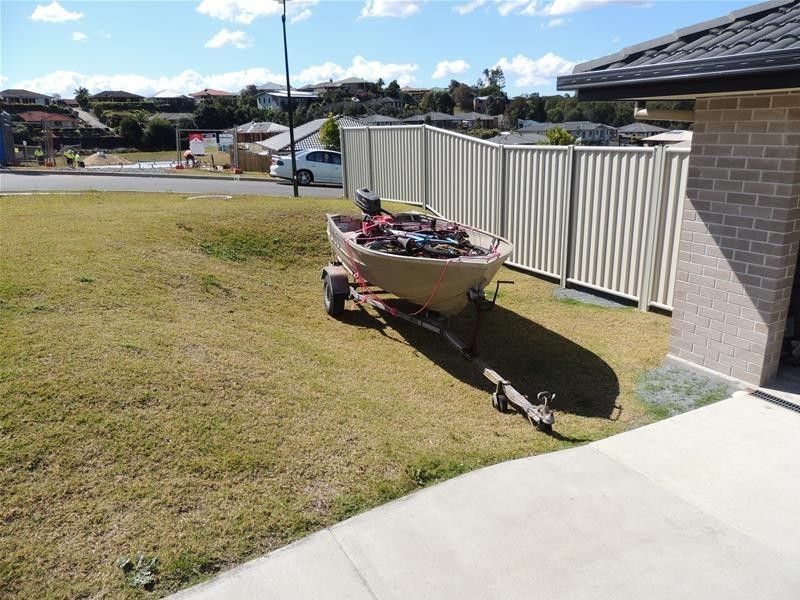
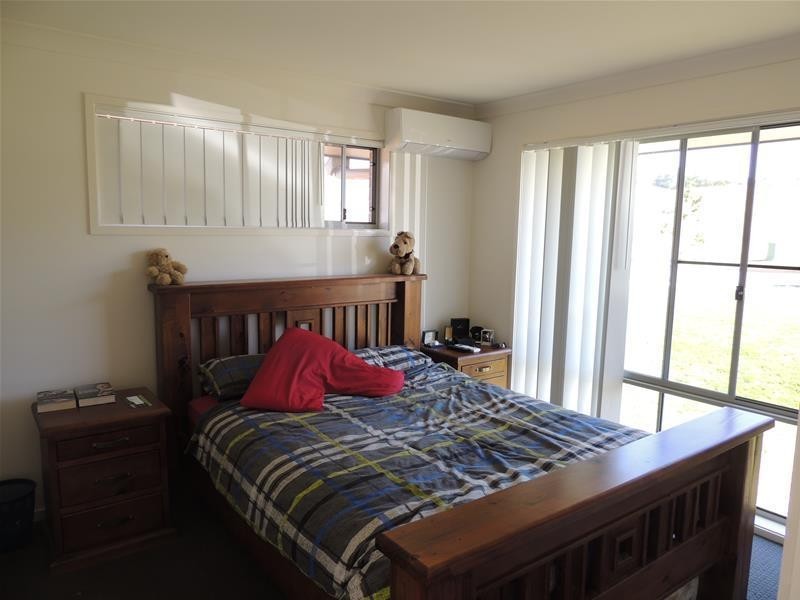
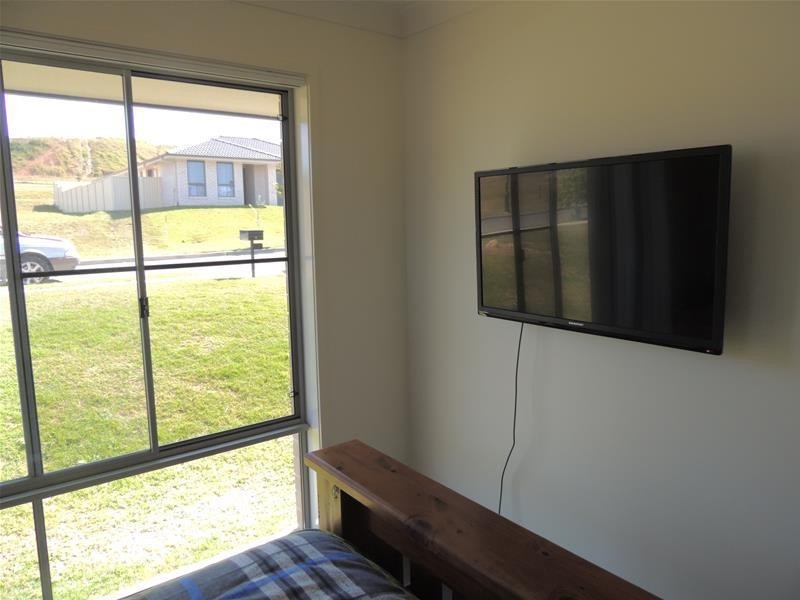
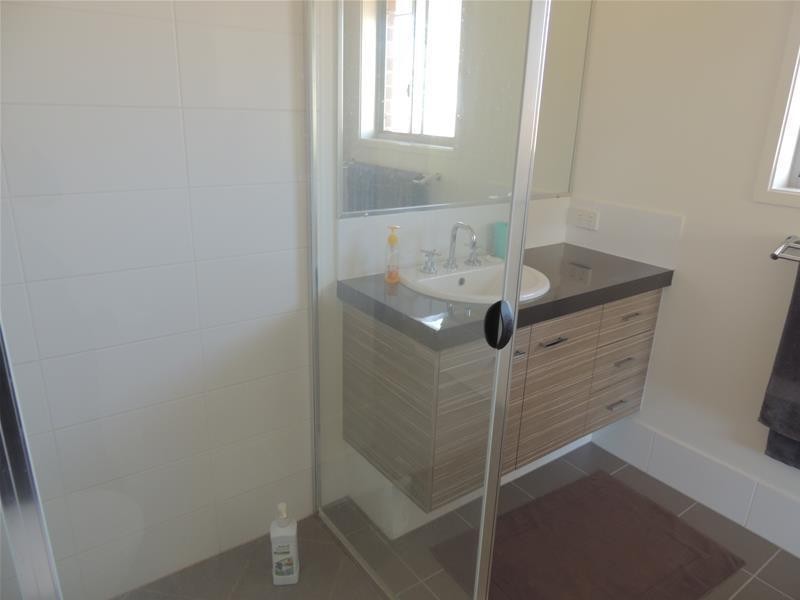
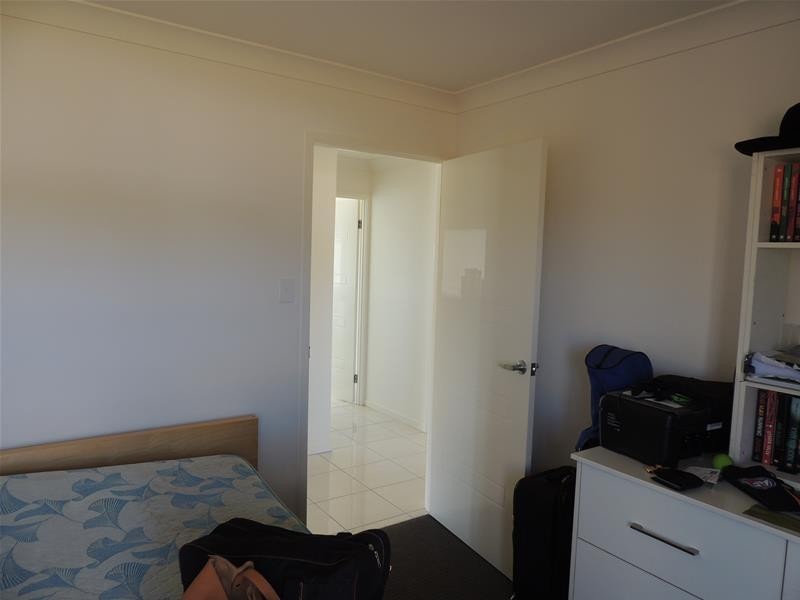
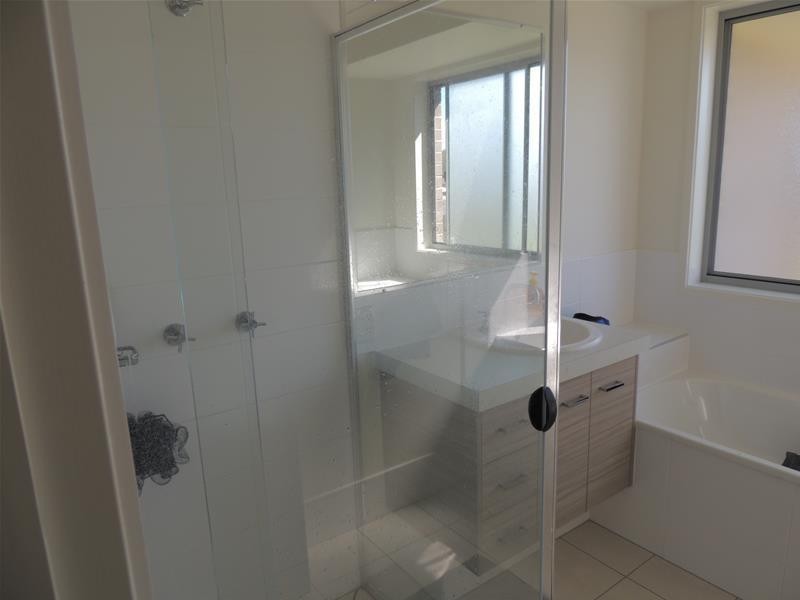
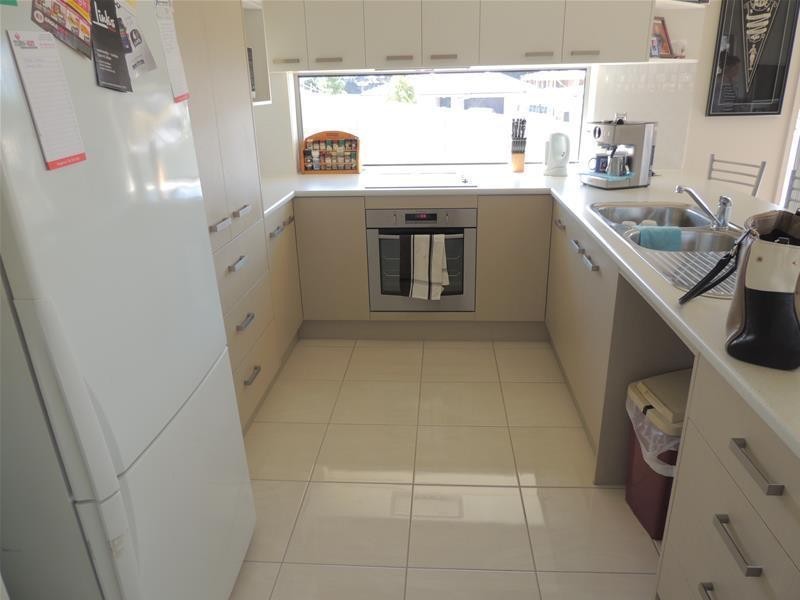
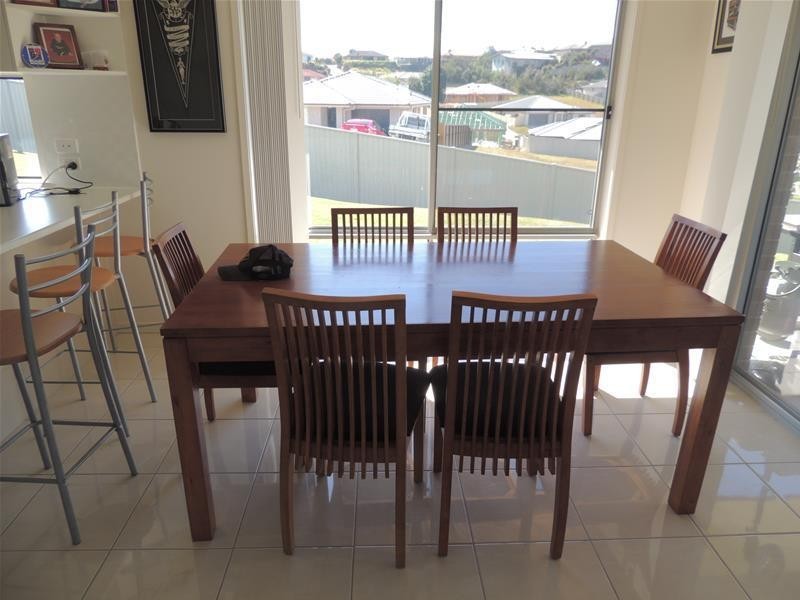
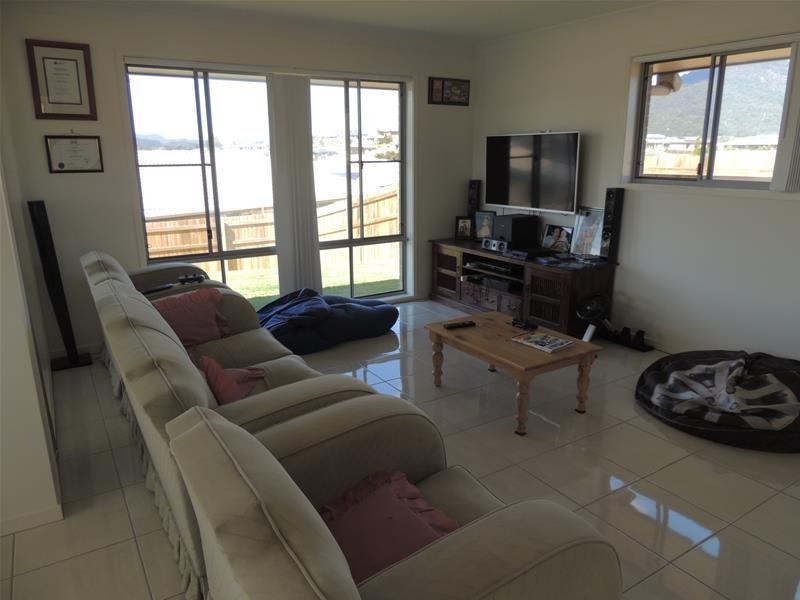
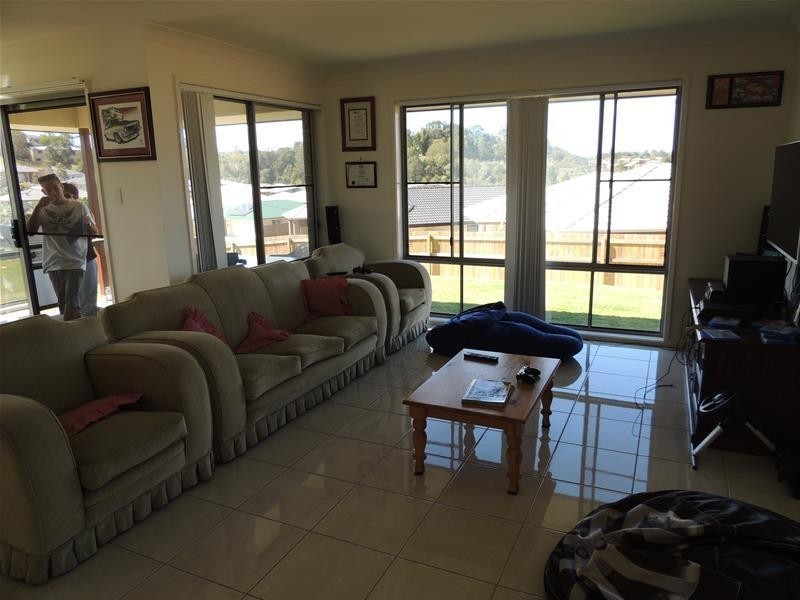
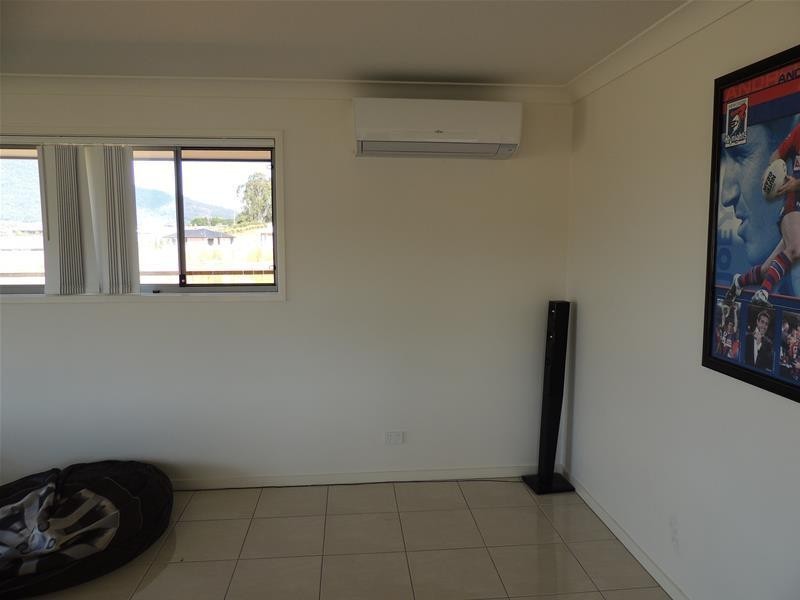
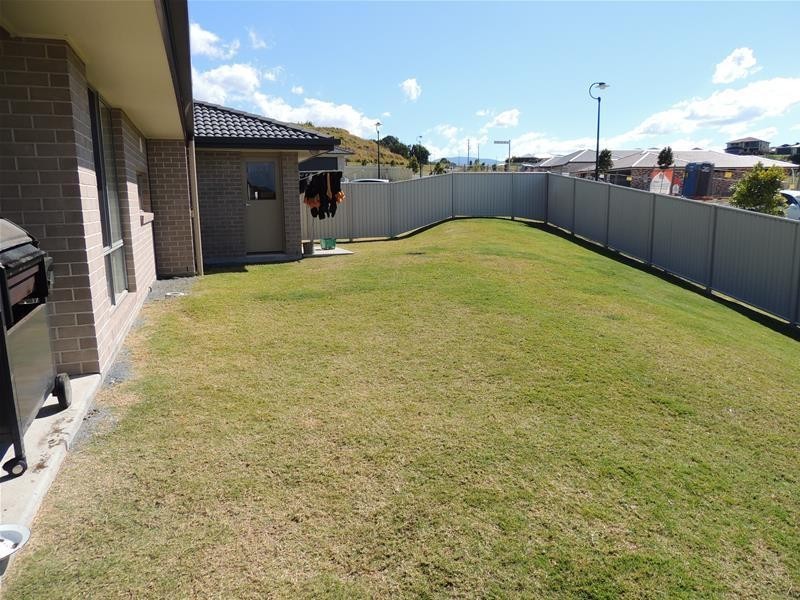
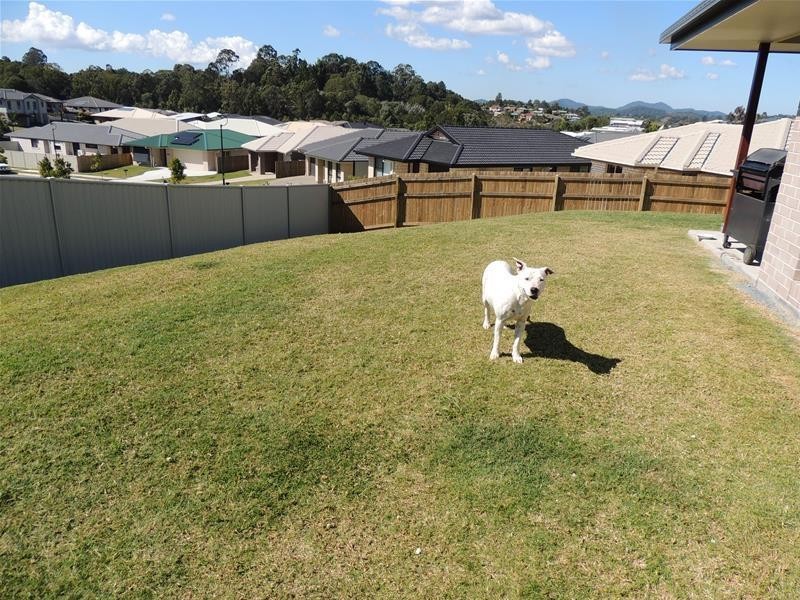
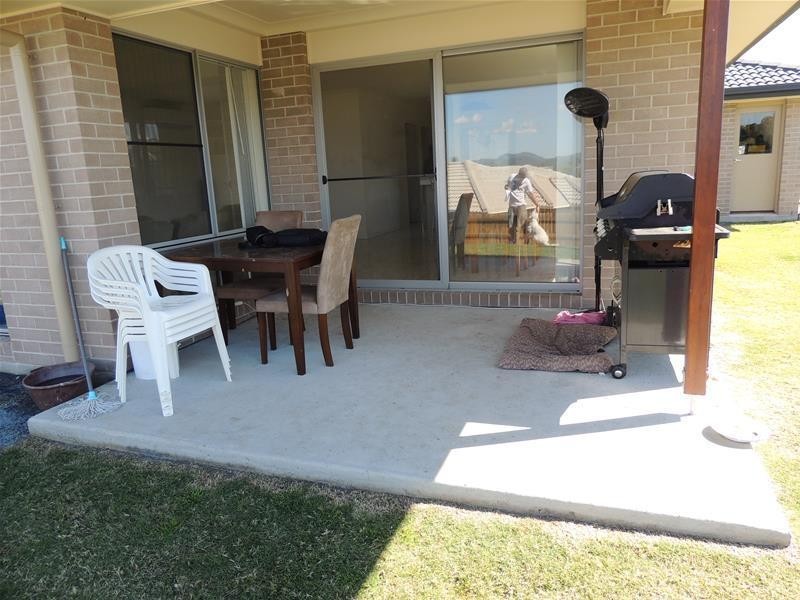
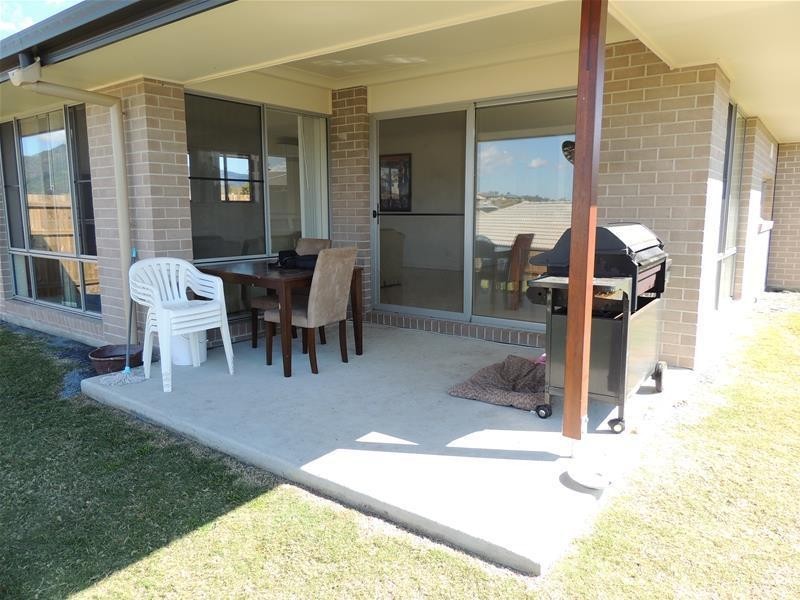
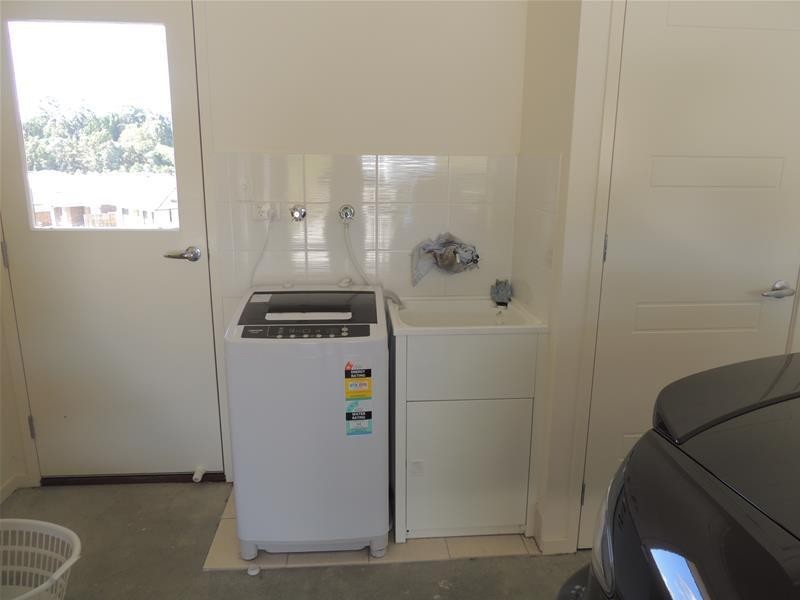
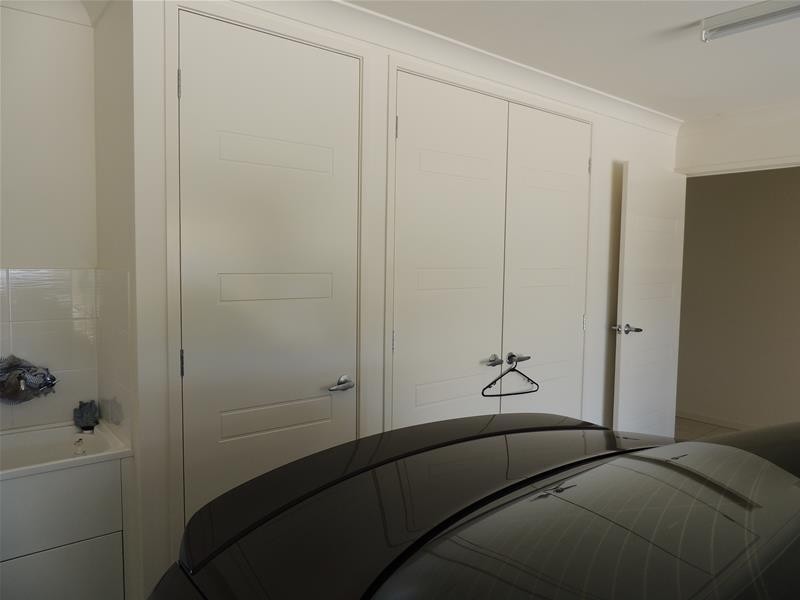
There are approximately 18,049 people living in Murwillumbah but… who are they?
44
49%
51%
Suburb Stats
$834/WK
$250/WK
$382/WK
Value of property in Murwillumbah and nearby suburbs
Murwillumbah
Byron Bay
Arrawarra Headland
Brushgrove
Average Home Price$478,633Average Rental Price$346Household Size2.5
Average Home Price$1,200,682Average Rental Price$826Household Size2.3
Average Home Price$709,769Average Rental Price$472Household Size2.5
Average Home Price$460,239Average Rental Price$327Household Size2.4
Water Useper year per person
0.6mln. litres
State Average 0.74 mln. litres
Nat. Average 0.74 mln. litres
Greenhouse Pollutionper year per person
16.48tonnes
State Average 19.31 tonnes
Nat. Average 20.3 tonnes
Dwelling Types
91%
5%
3%
Most Common Suburb Professions
17% Professio…
15% Technicia…
14% Managers…
12% Labourers…
Nearby schools: murwillumbah south infants school, murwillumbah high school, murwillumbah east primary school, mt st patrick college
Nearby cafes: fish bowl cafe, sugar beat cafe, the modern grocer, cenzo cafe
Nearby doctors: king street dental practice, king street medical centre- dr. j. stephenson, rightfoot podiatry & footwear clinics, main street medical centre
Nearby hospitals: murwillumbah district hospital, king street medical centre, queen street medical centre