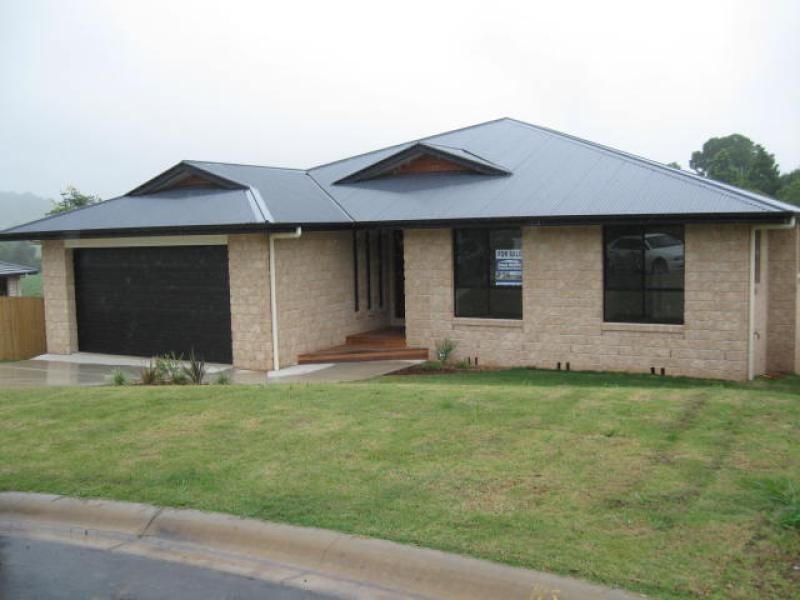
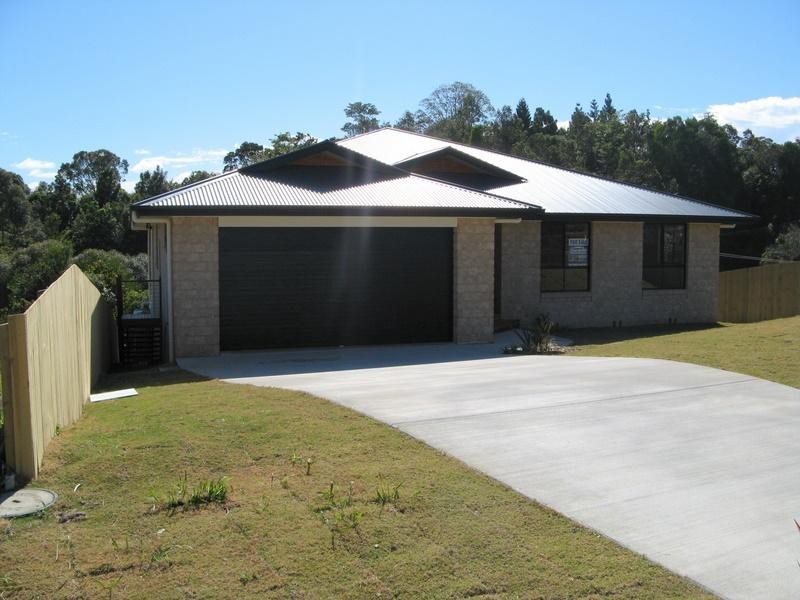
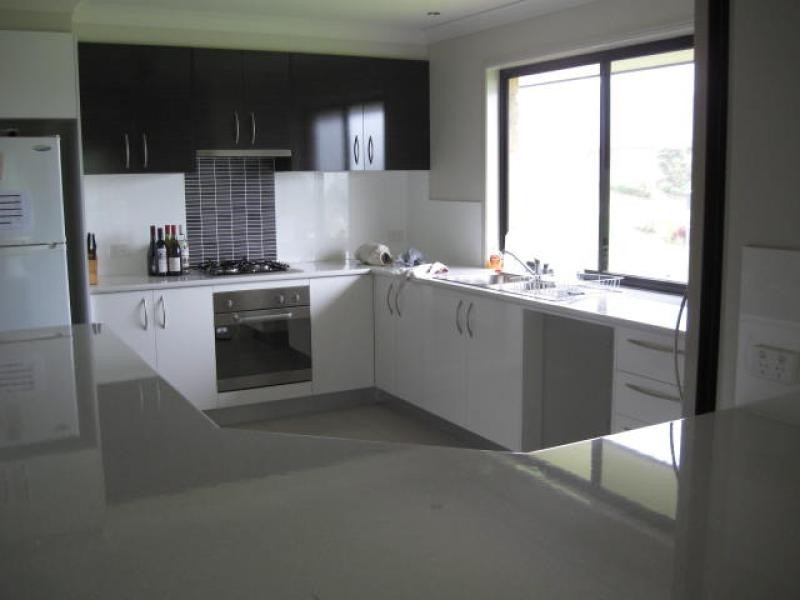
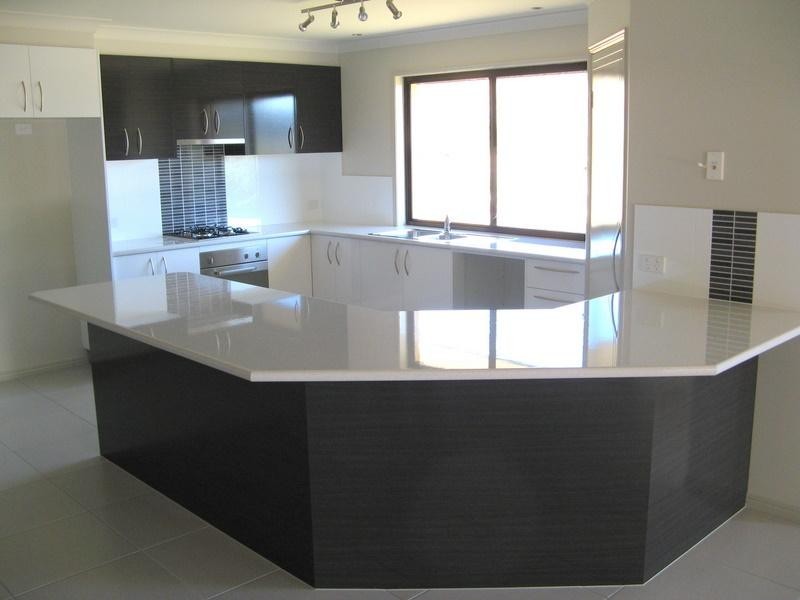
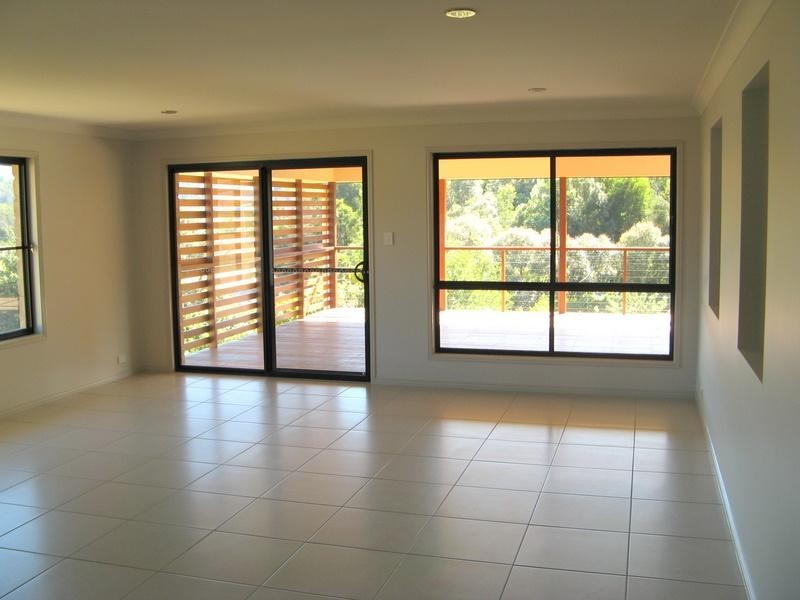
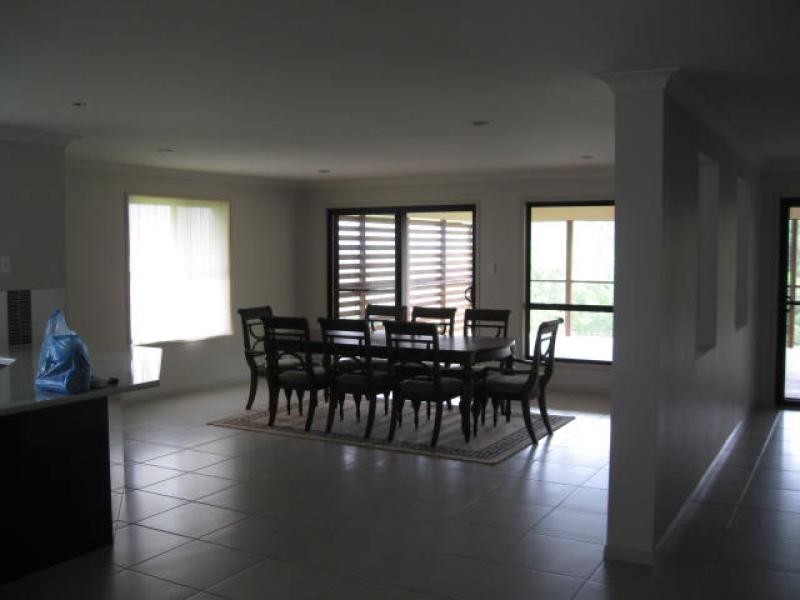
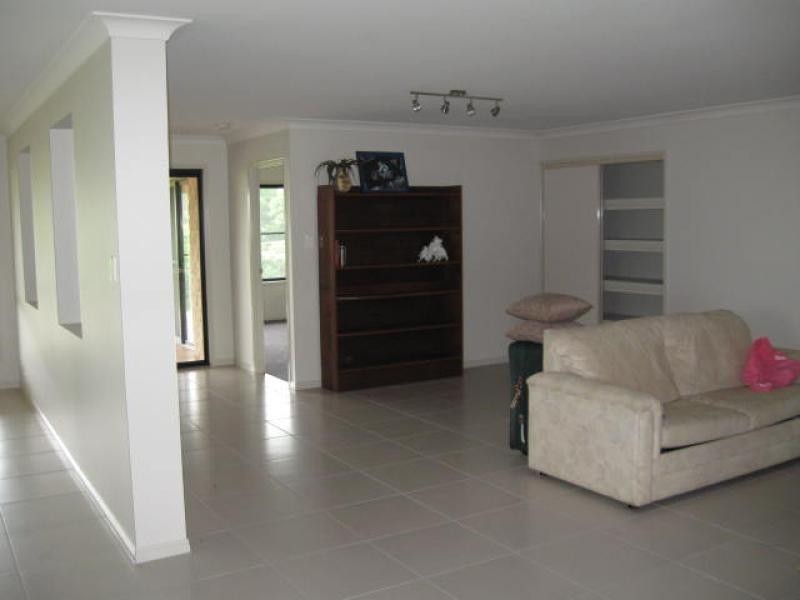
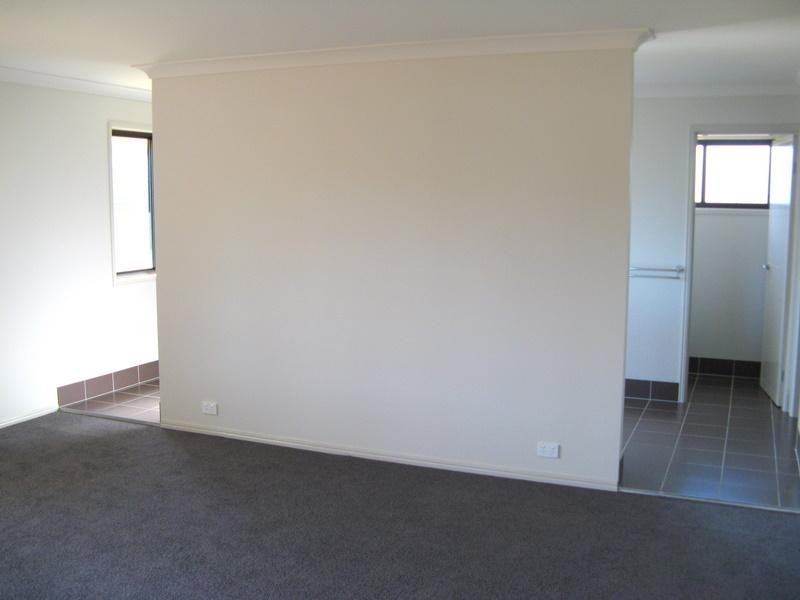
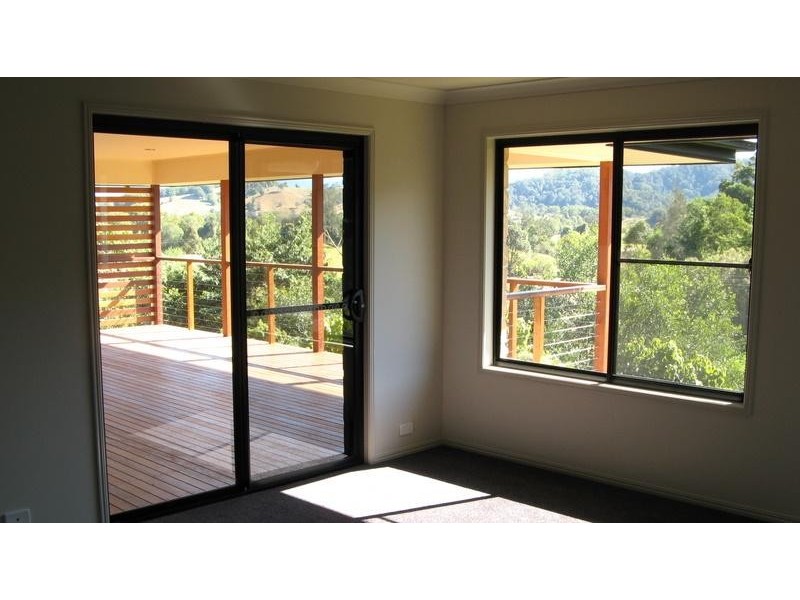
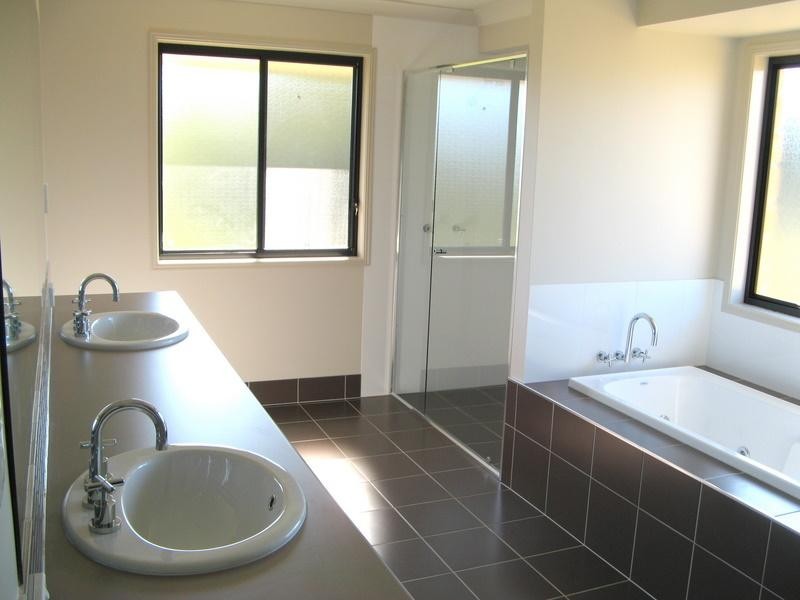
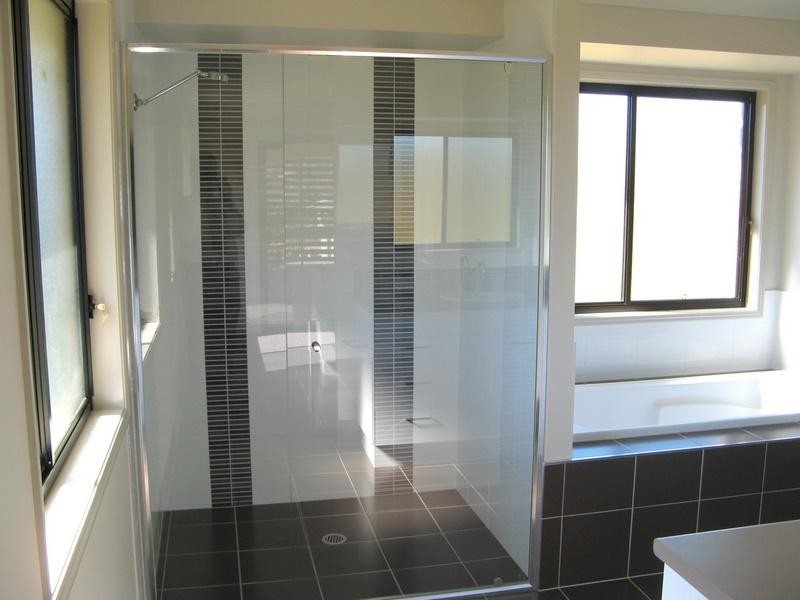
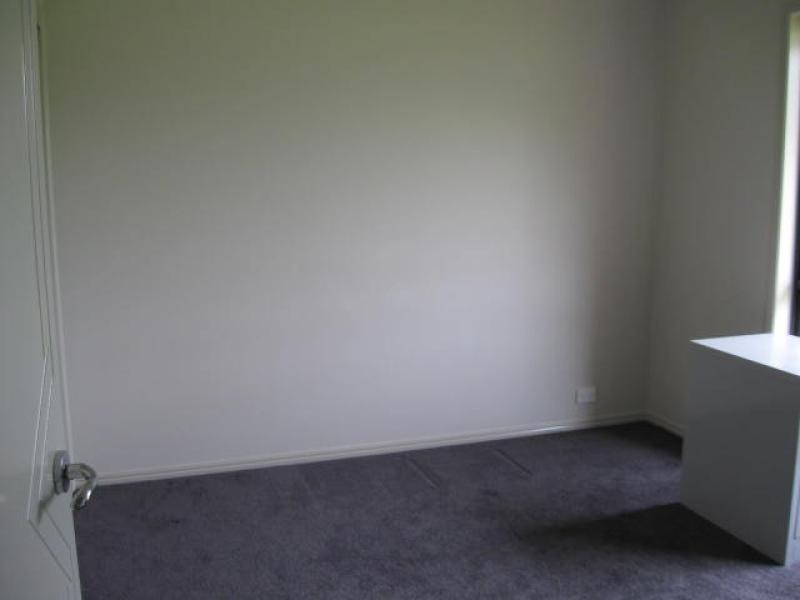
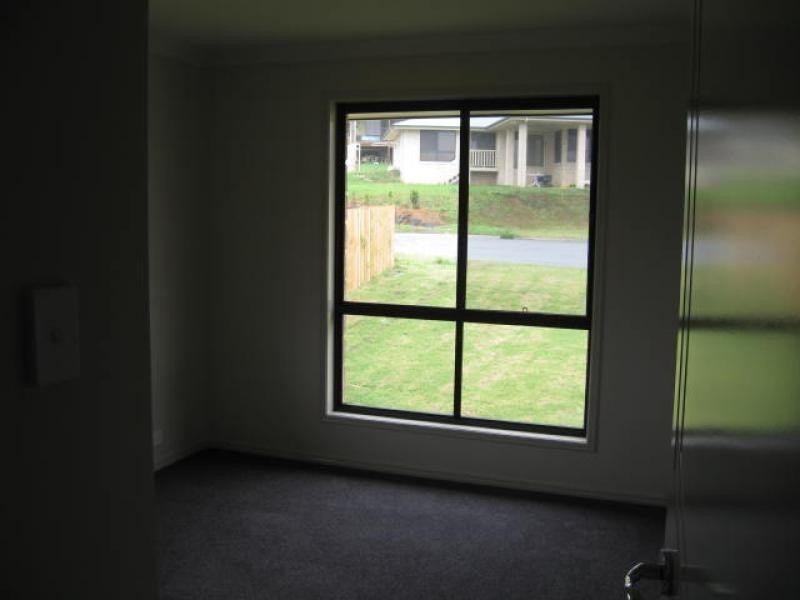
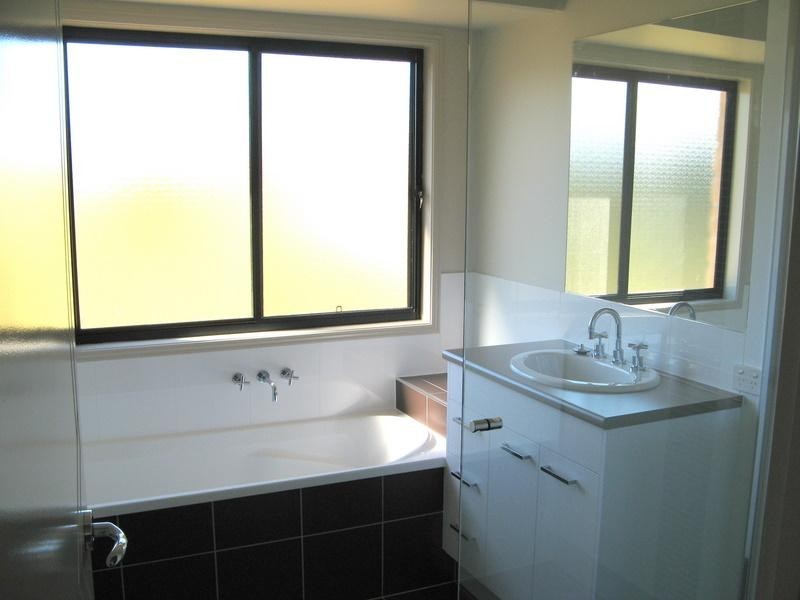
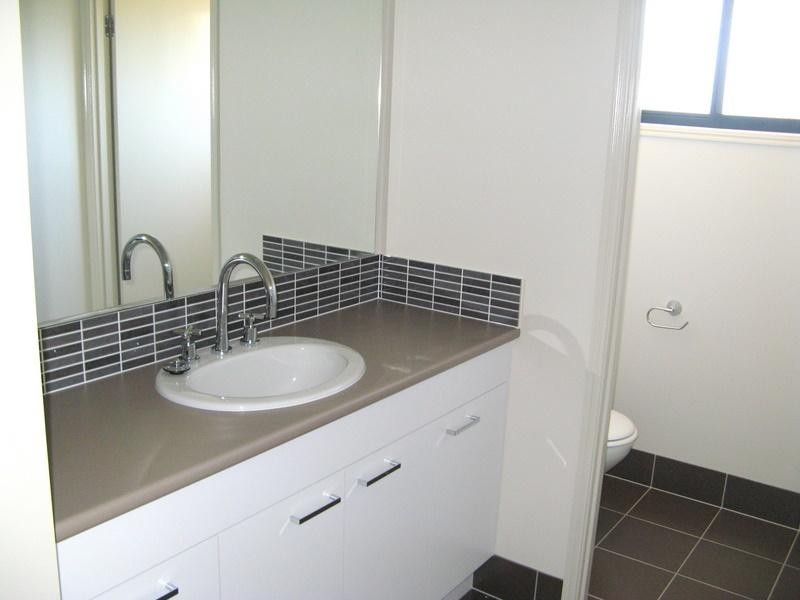
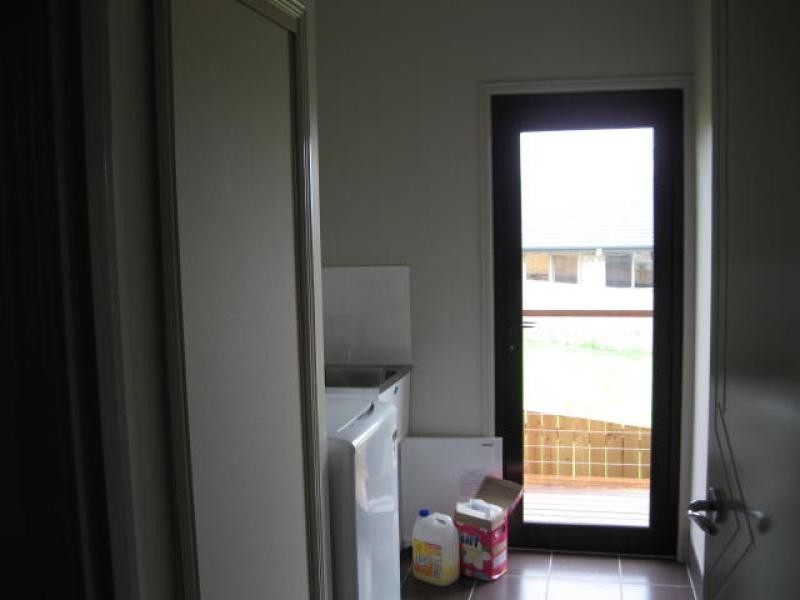
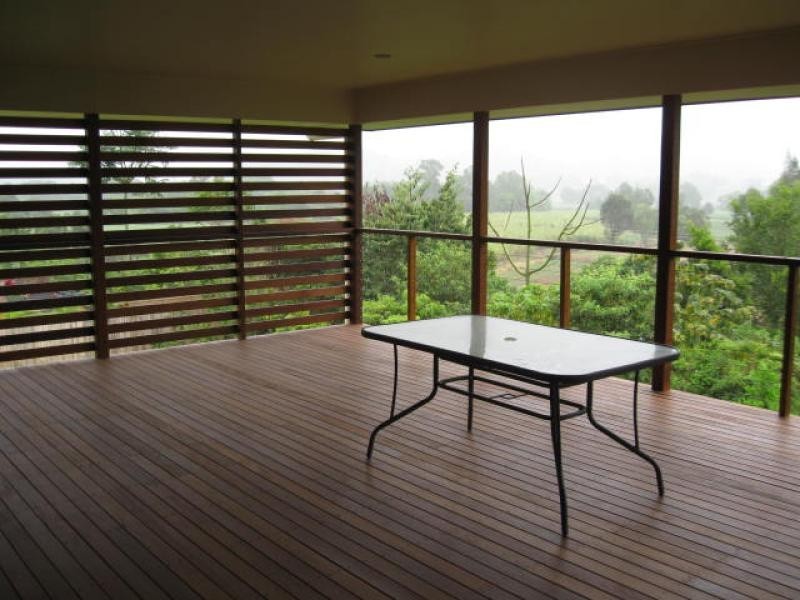
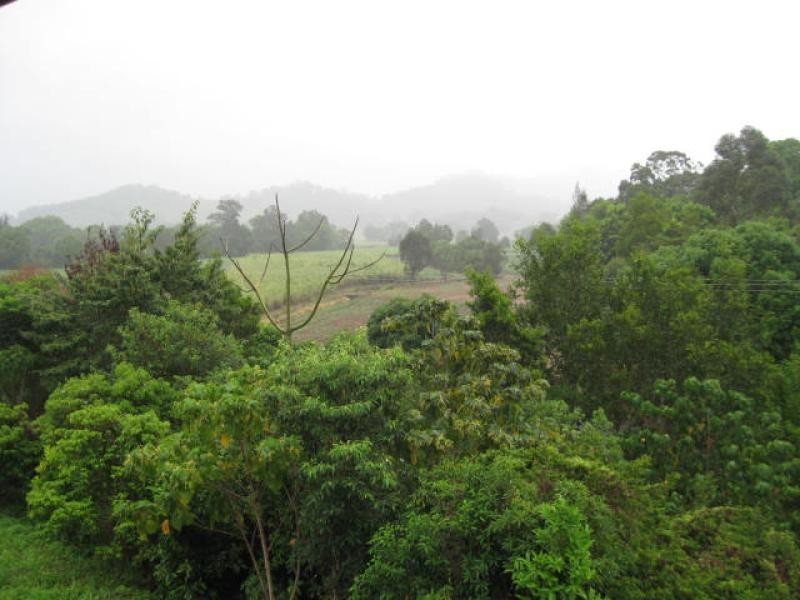
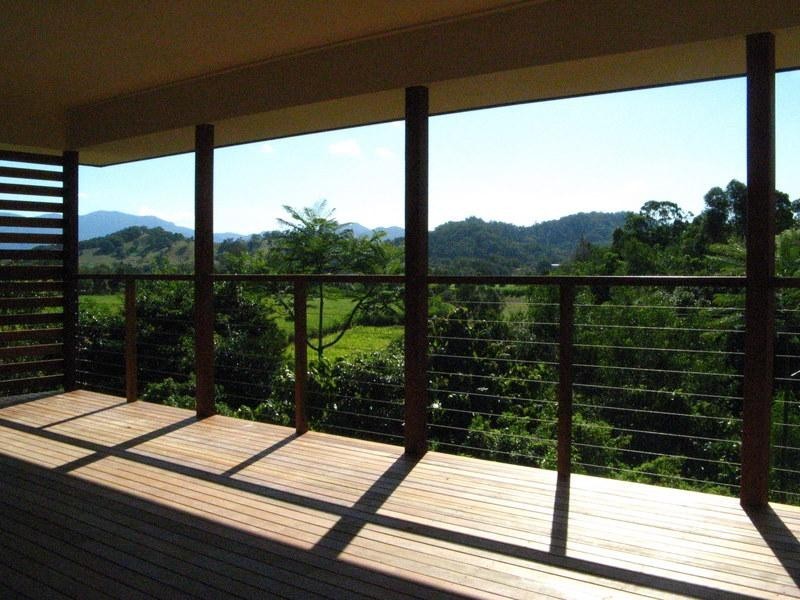
53 Mt Ernest Crescent, Murwillumbah NSW 2484 Near New 4 bdr Executive Home $410 per week Listing history: 30 Oct, 2009 4 2 2 Listing ID: 10394576 Other properties to rent near 53 Mt Ernest Crescent, Murwillumbah NSW 2484 43a Mt Ernest Crescent, Murwillumbah NSW 2484 Location THIS PROPERTY WAS LEASED Enquiry about this property Name* Email* Phone* Message* Send me regular newsletters from Homehound Have agents get in touch about similar properties within the area What is 8 + 20?* Receive email alerts for properties like this Email alerts Email* Send me regular newsletters from Homehound. Have agents get in touch about similar properties within the area What is 8 + 20?*