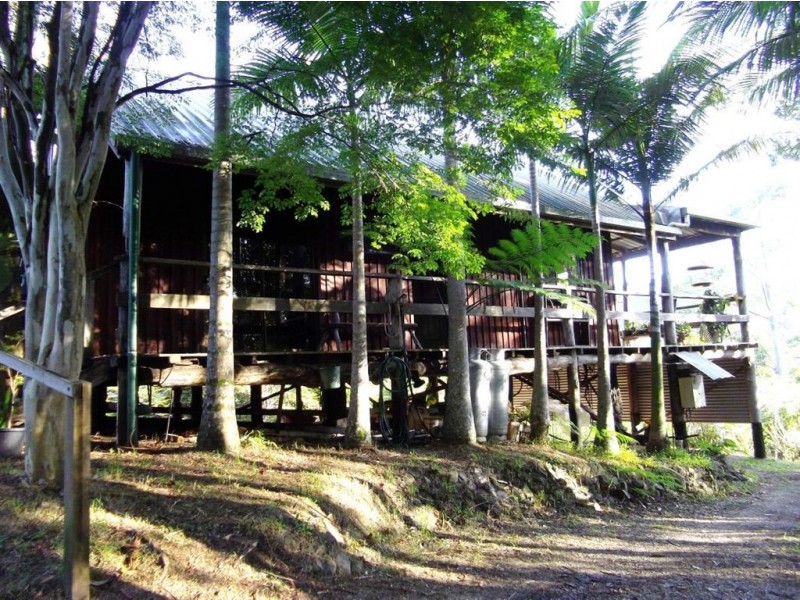
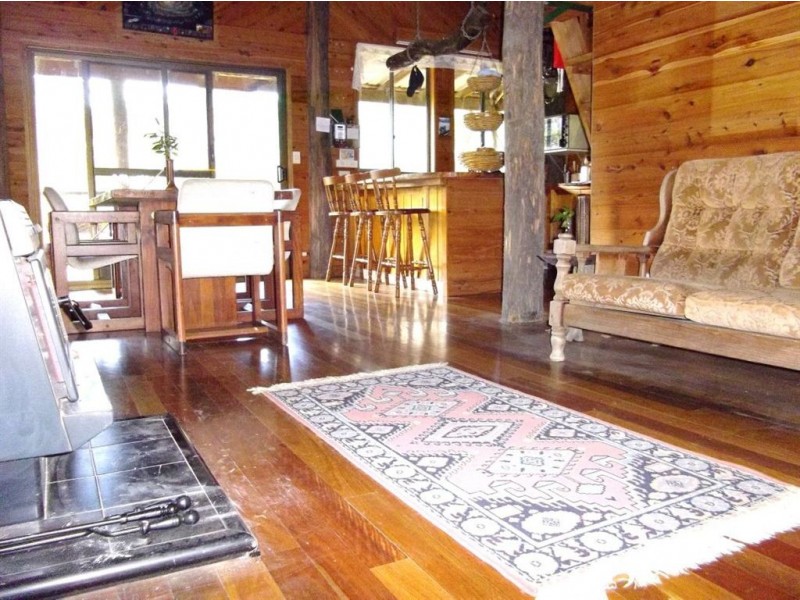
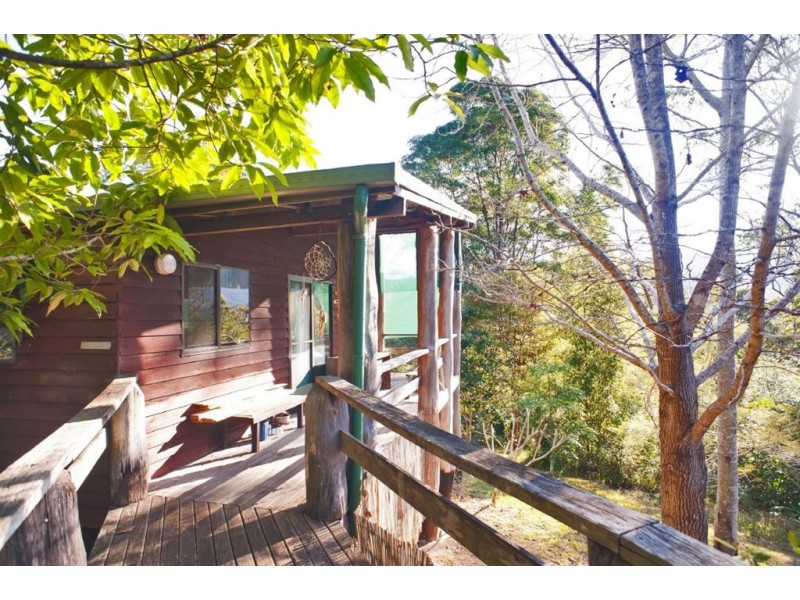
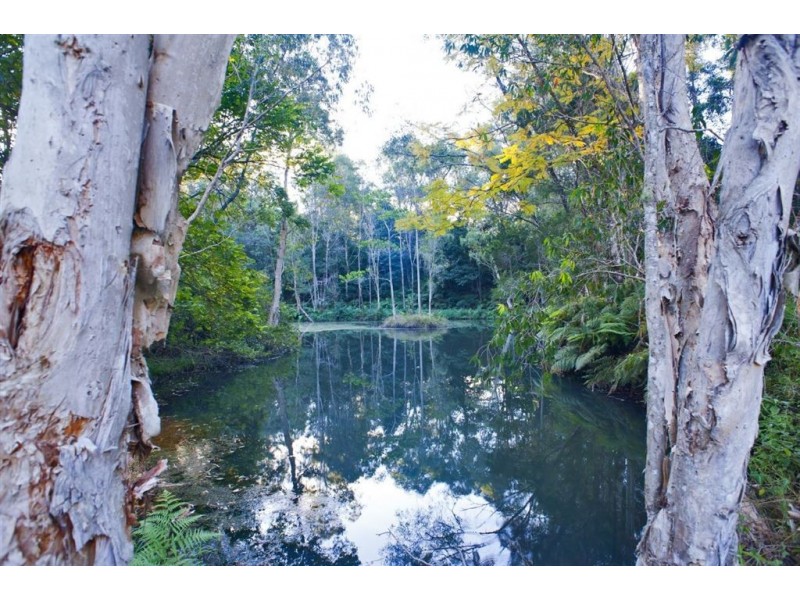
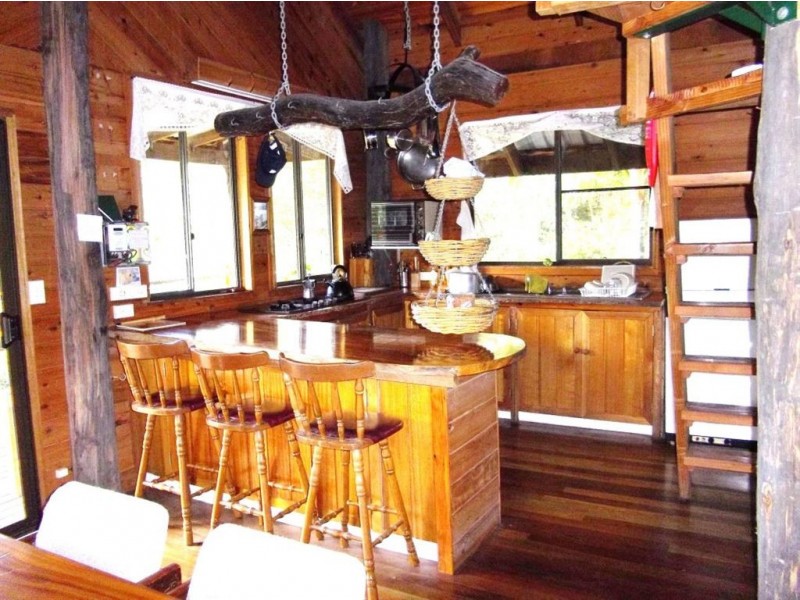
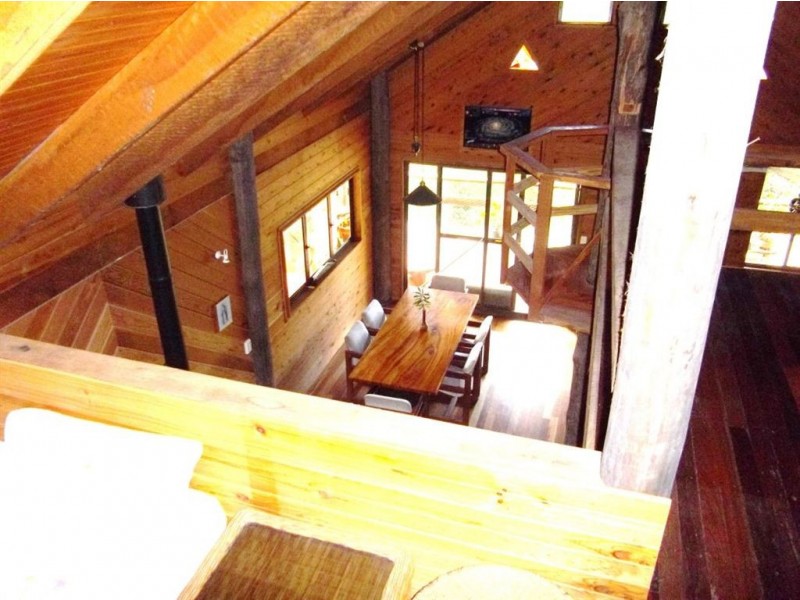
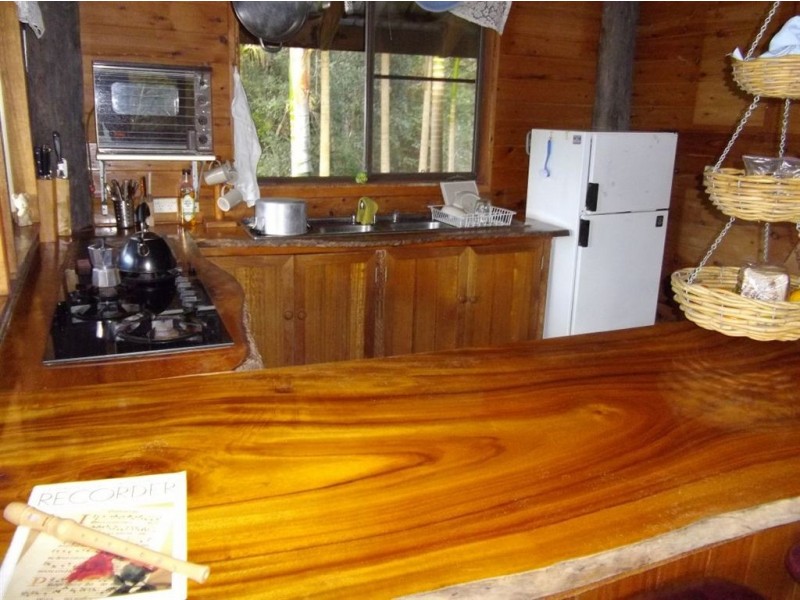
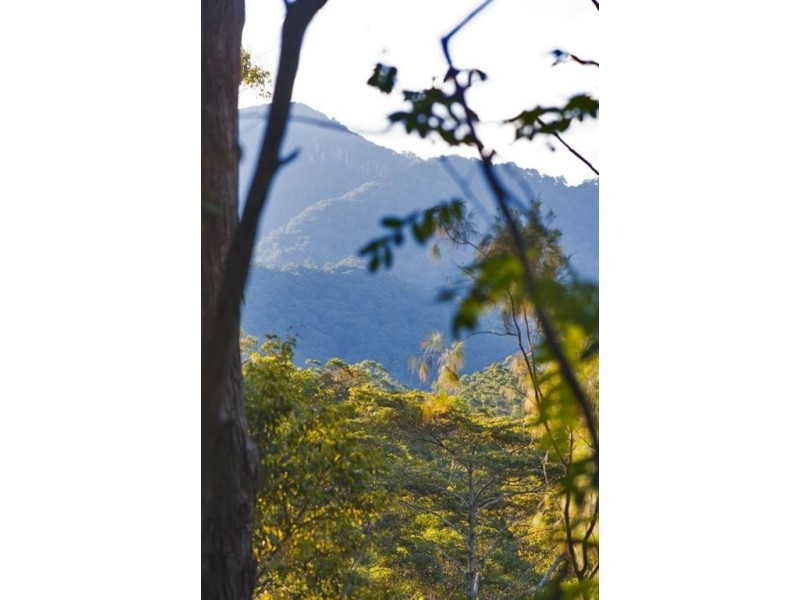
There are approximately 18,049 people living in Murwillumbah but… who are they?
44
49%
51%
Suburb Stats
$834/WK
$250/WK
$382/WK
Value of property in Murwillumbah and nearby suburbs
Murwillumbah
Chillingham
Safety Beach
Tumbulgum
Average Home Price$479,070Average Rental Price$346Household Size2.5
Average Home Price$484,579Average Rental Price$325Household Size2.5
Average Home Price$575,379Average Rental Price$454Household Size2.5
Average Home Price$547,085Average Rental Price$442Household Size2.7
Water Useper year per person
0.6mln. litres
State Average 0.74 mln. litres
Nat. Average 0.74 mln. litres
Greenhouse Pollutionper year per person
16.48tonnes
State Average 19.31 tonnes
Nat. Average 20.3 tonnes
Dwelling Types
91%
5%
3%
Most Common Suburb Professions
17% Professio…
15% Technicia…
14% Managers…
12% Labourers…
Nearby schools: mt st patrick college, murwillumbah community college, murwillumbah east primary school, murwillumbah high school
Nearby cafes: sugar beat cafe, dabelles cafe, fish bowl cafe, king street cafe
Nearby doctors: main street medical centre, king street dental practice - dr. evans michael, rightfoot podiatry & footwear clinics, advanced radiology clinics murwillumbah
Nearby hospitals: murwillumbah district hospital, king street medical centre, queen street medical centre