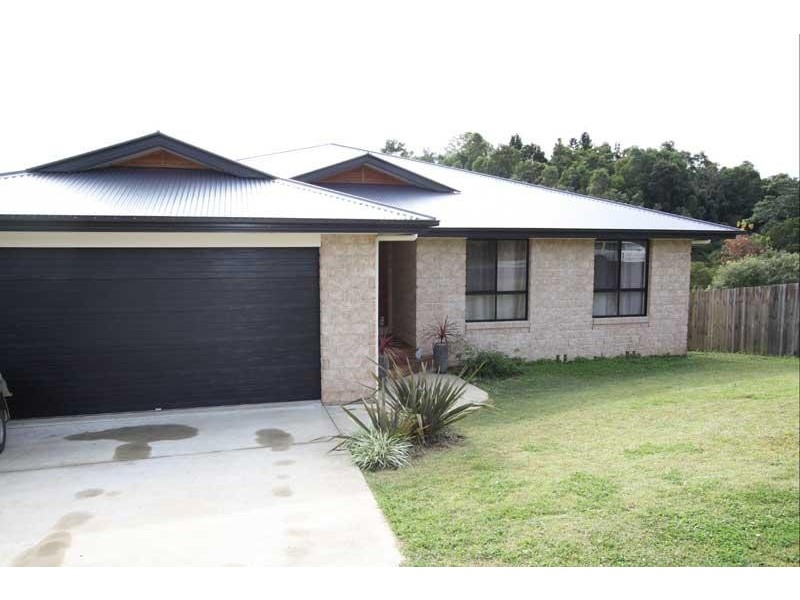
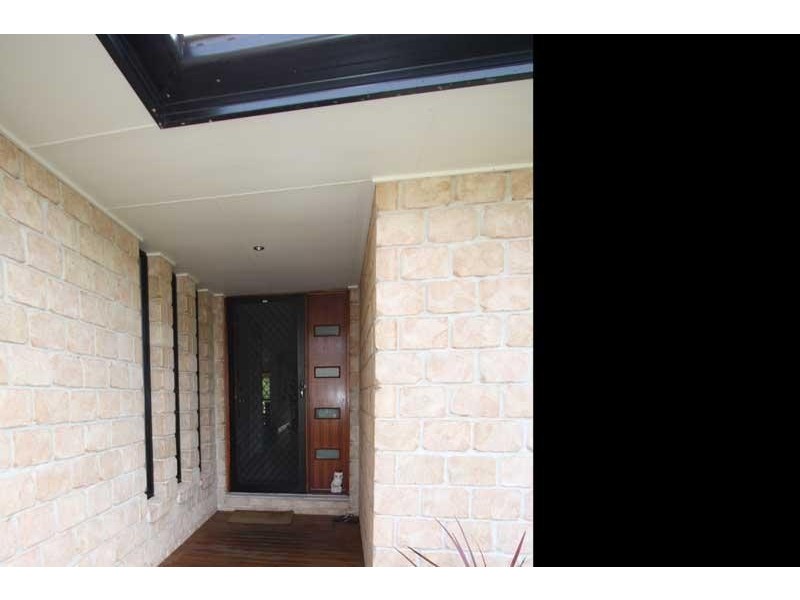
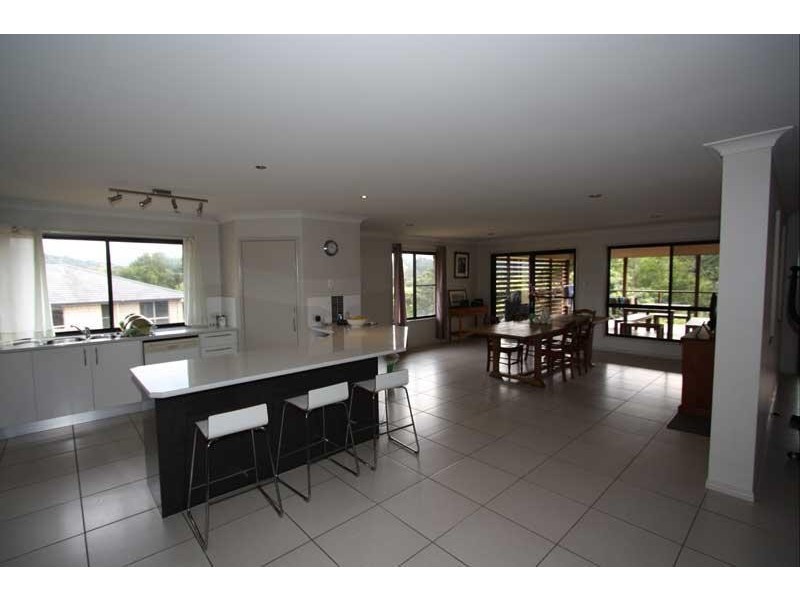
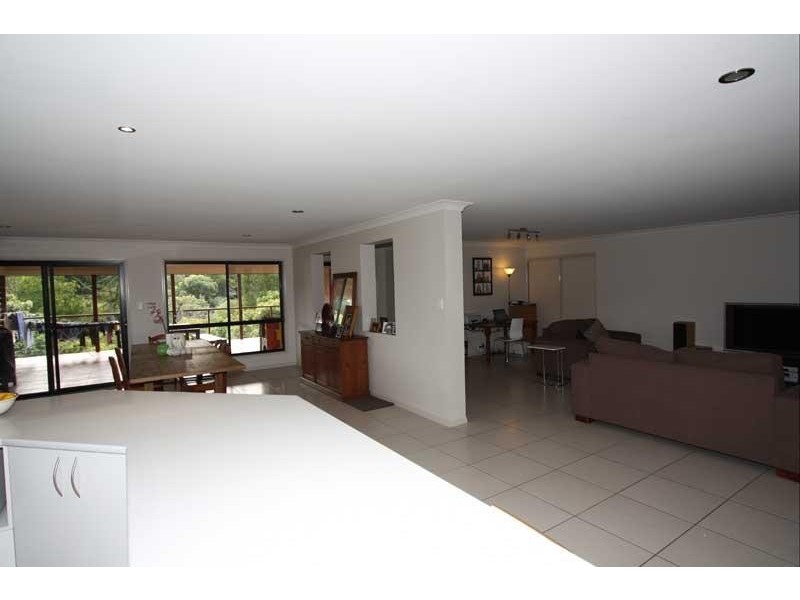
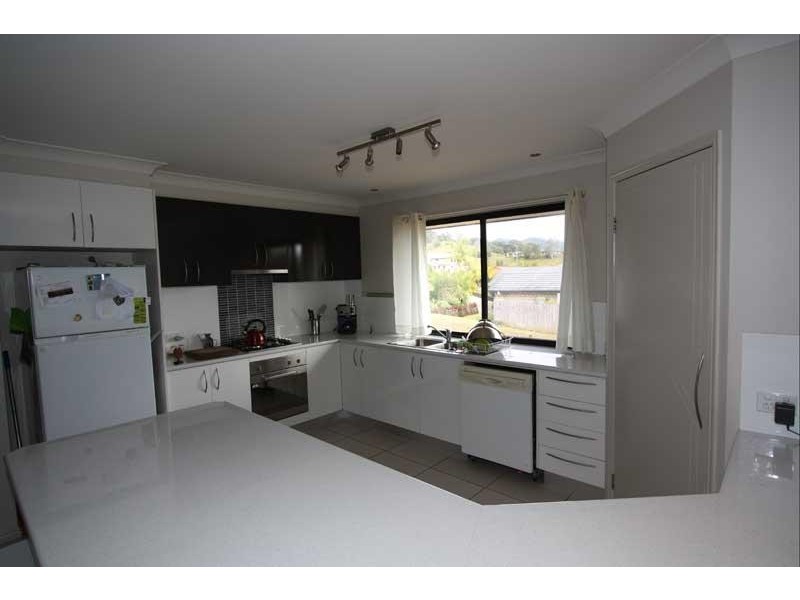
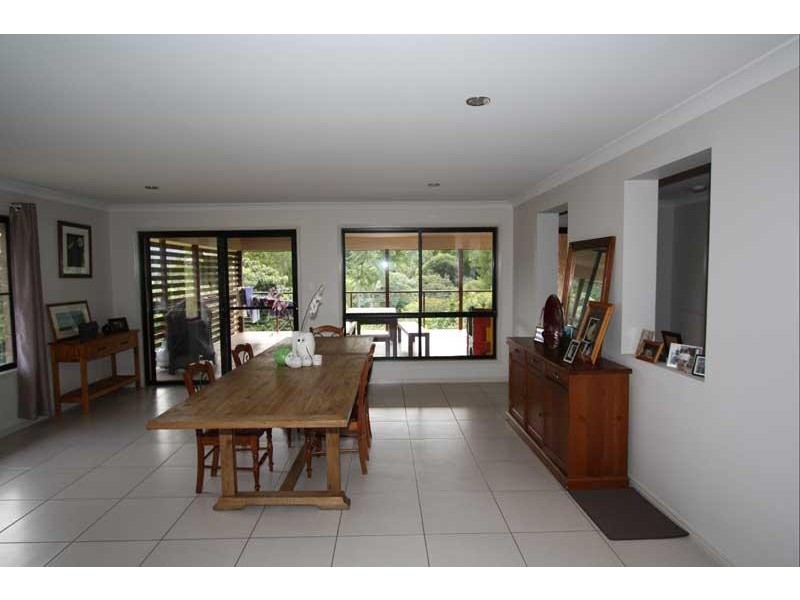
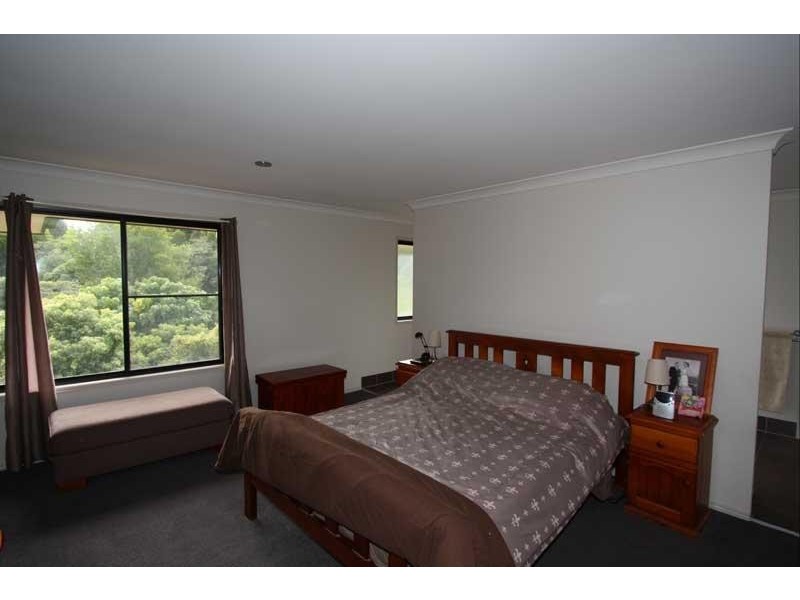
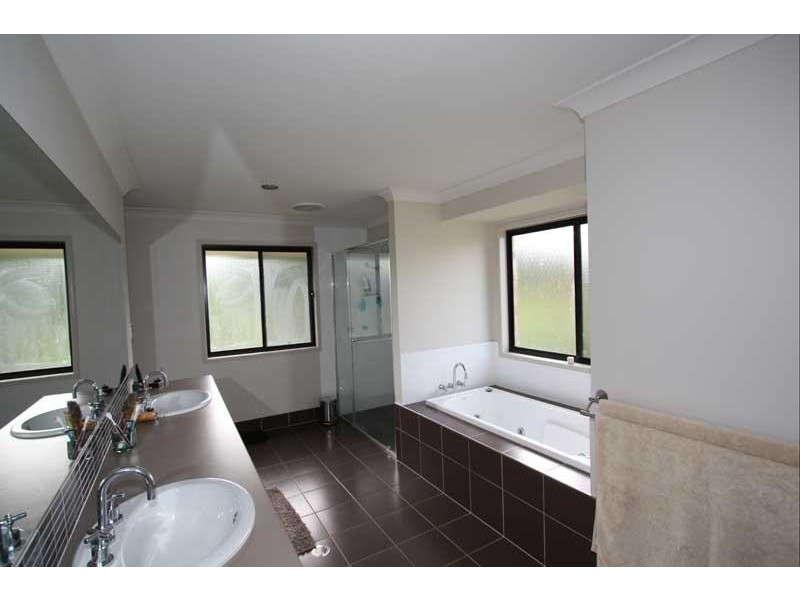
There are approximately 18,049 people living in Murwillumbah but… who are they?
44
49%
51%
Suburb Stats
$834/WK
$250/WK
$382/WK
Value of property in Murwillumbah and nearby suburbs
Murwillumbah
Nymboida
Coraki
Corndale
Average Home Price$479,070Average Rental Price$346Household Size2.5
Average Home Price$315,036Average Rental Price$434Household Size2.4
Average Home Price$305,645Average Rental Price$281Household Size2.7
Average Home Price$841,931Average Rental Price$405Household Size2.4
Water Useper year per person
0.6mln. litres
State Average 0.74 mln. litres
Nat. Average 0.74 mln. litres
Greenhouse Pollutionper year per person
16.48tonnes
State Average 19.31 tonnes
Nat. Average 20.3 tonnes
Dwelling Types
91%
5%
3%
Most Common Suburb Professions
17% Professio…
15% Technicia…
14% Managers…
12% Labourers…
Nearby schools: murwillumbah community college, murwillumbah high school, murwillumbah east primary school, murwillumbah south infants school
Nearby cafes: fish bowl cafe, cenzo cafe, sugar beat cafe, auto cafe
Nearby doctors: advanced radiology clinics murwillumbah, king street medical centre-dr alan secombe, qml pathology, king street medical centre-dr john moran
Nearby hospitals: king street medical centre, murwillumbah district hospital, queen street medical centre