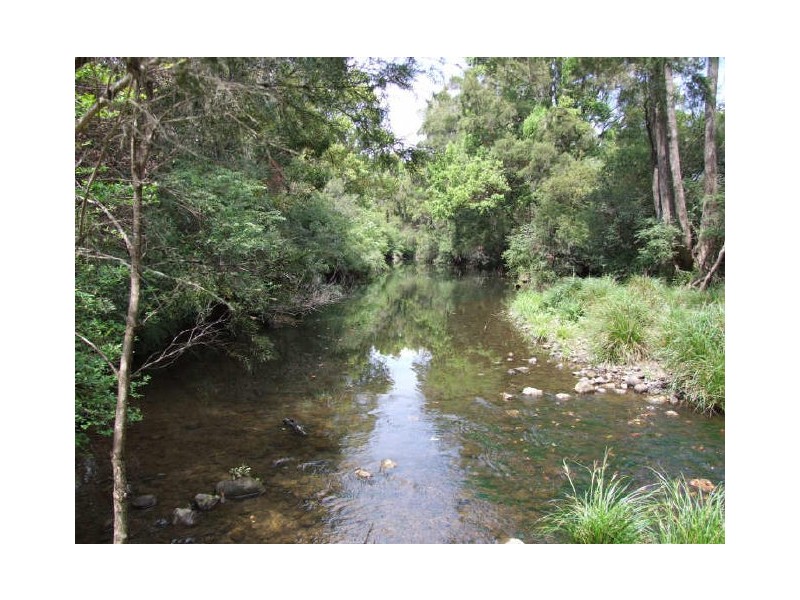
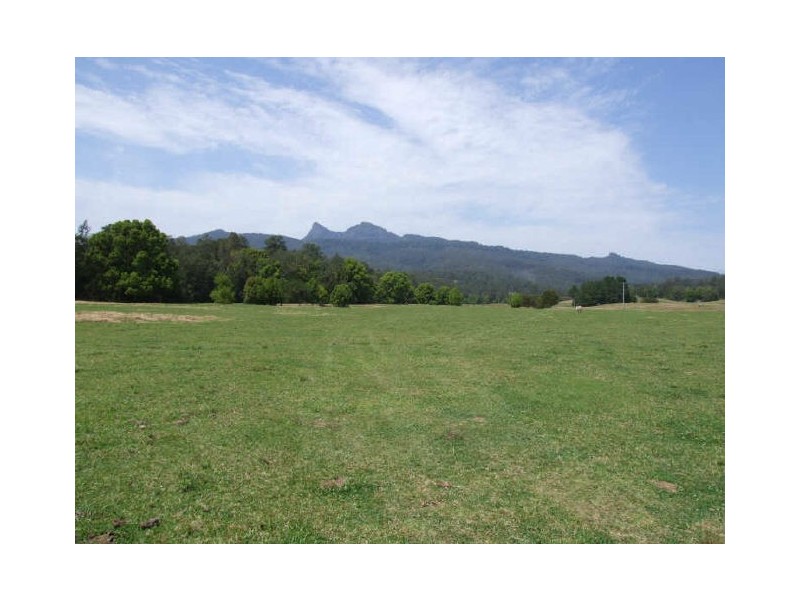
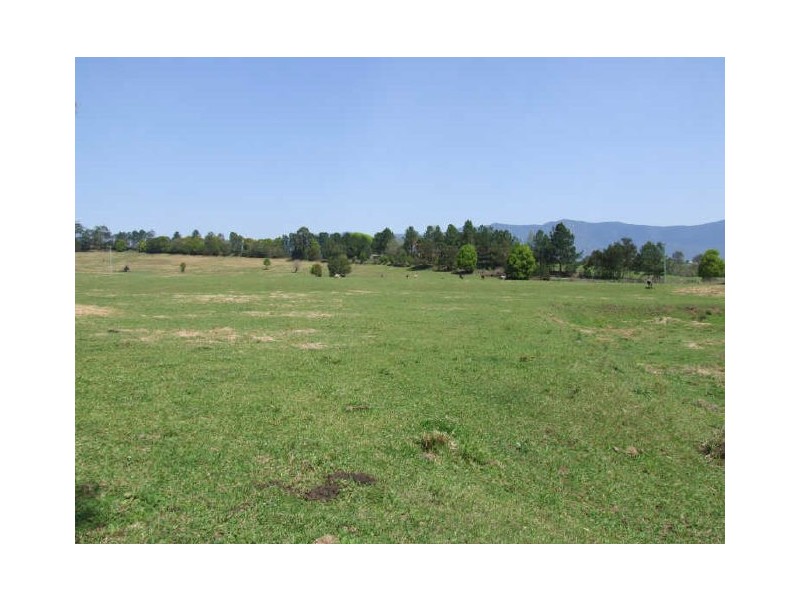
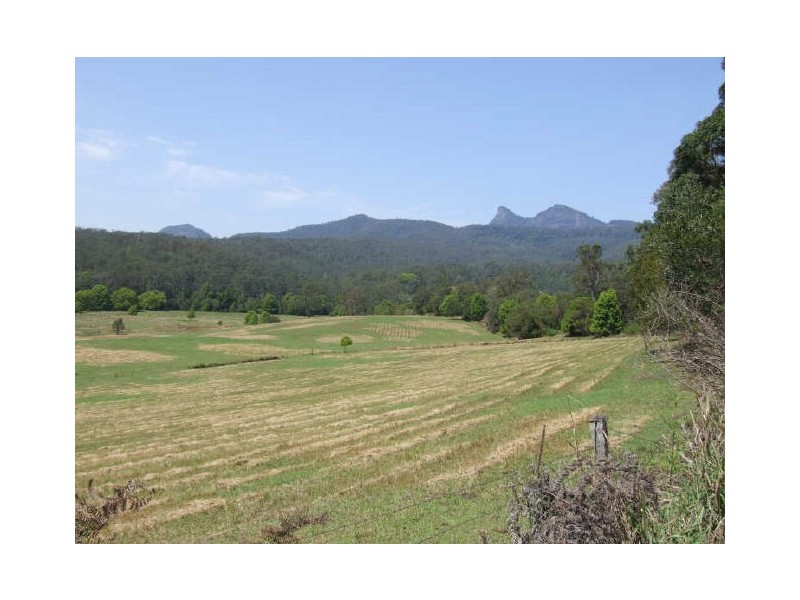
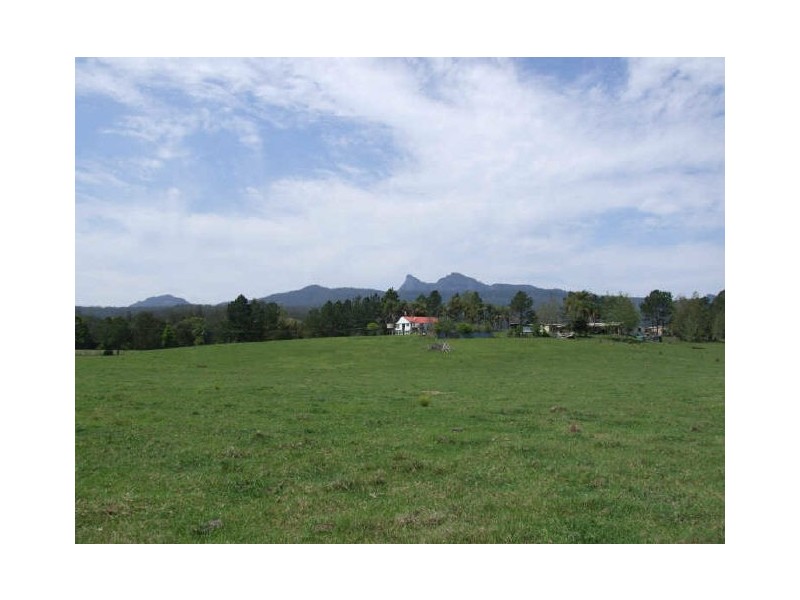
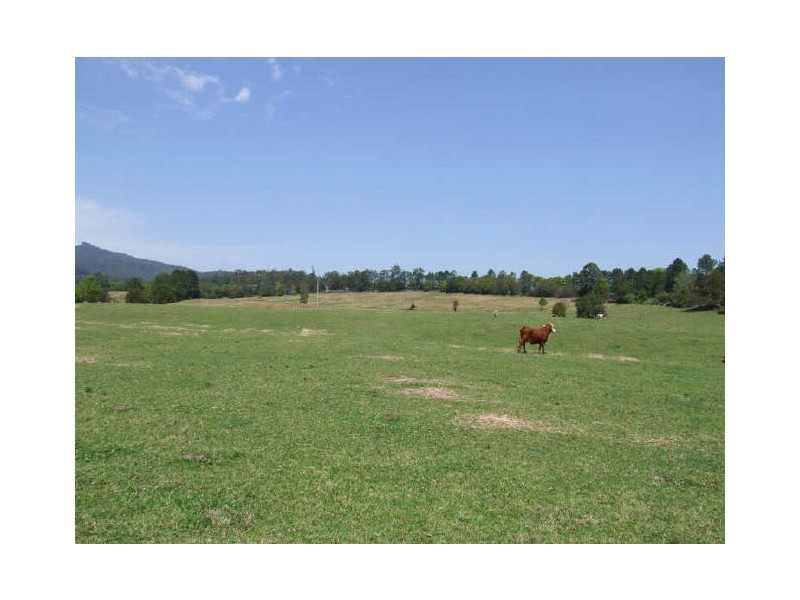
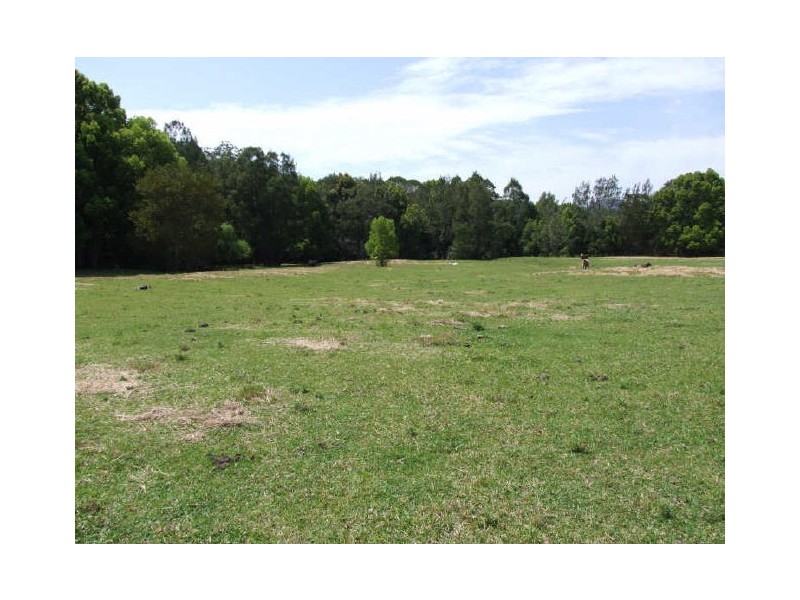
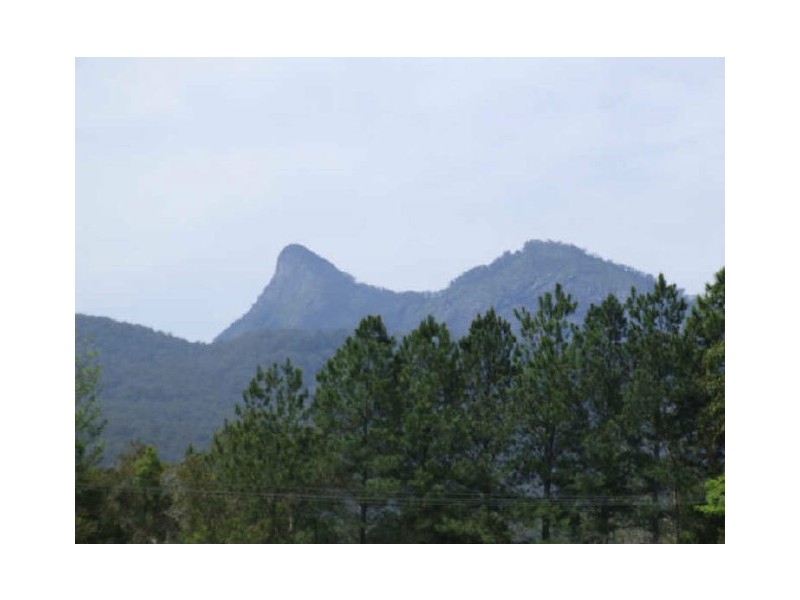
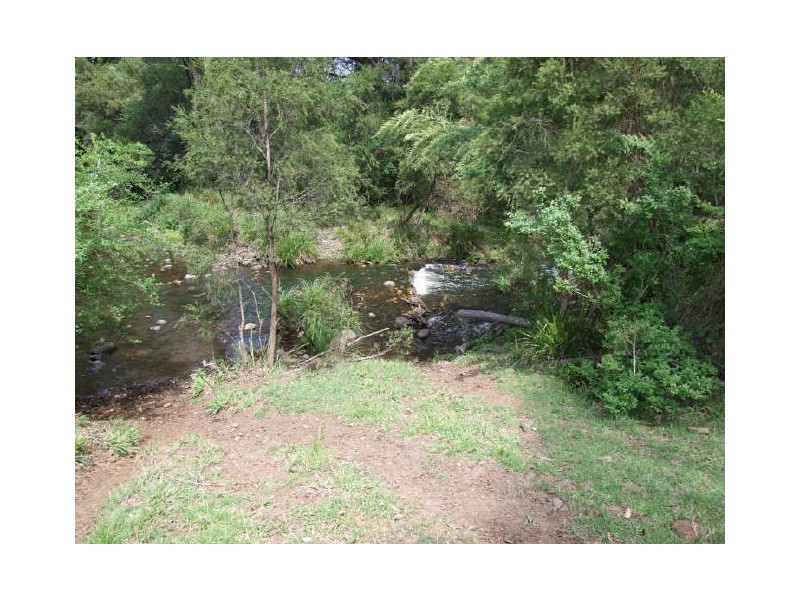
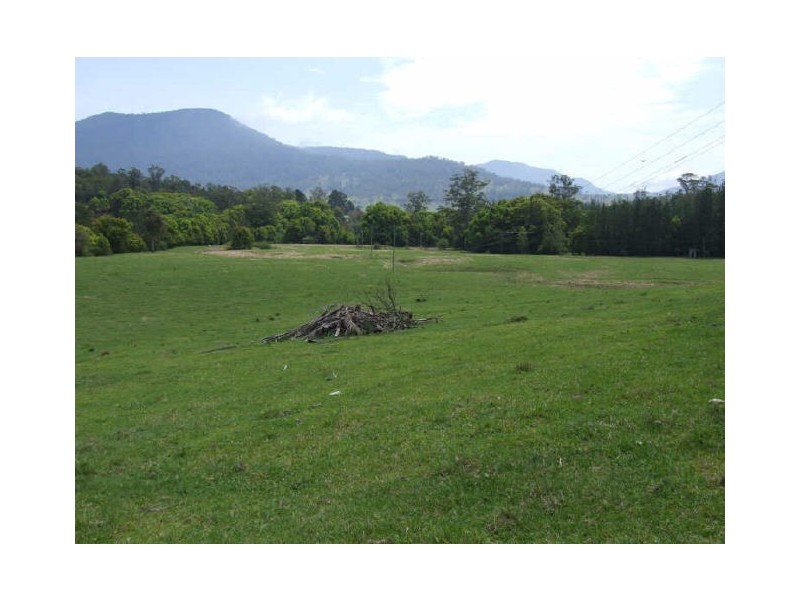
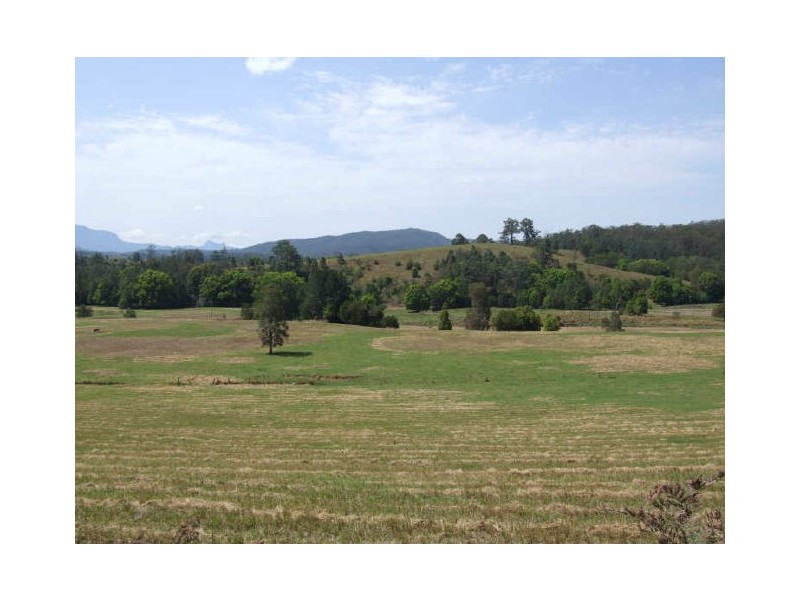
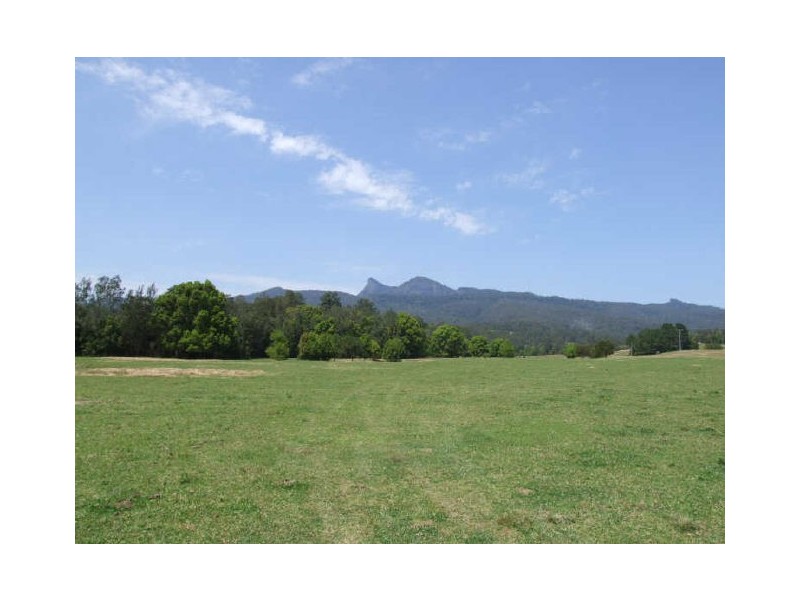
Murwillumbah NSW 2484 WATER HAVEN, BREATHTAKING COUNTRYSIDE VIEWS! $1,150,000 ? ? ? Listing ID: 3164581 Other properties for sale near Murwillumbah NSW 2484 32 George Street, Murwillumbah NSW 2484 3/55 William Street, Murwillumbah NSW 2484 103 Treetops Boulevard, Murwillumbah NSW 2484 35 Tumbulgum Road, Murwillumbah NSW 2484 14 Lakeside Drive, Murwillumbah NSW 2484 Location THIS PROPERTY WAS WITHDRAWN Enquiry about this property Name* Email* Phone* Message* Send me regular newsletters from Homehound Have agents get in touch about similar properties within the area What is 8 + 20?* Receive email alerts for properties like this Email alerts Email* Send me regular newsletters from Homehound. Have agents get in touch about similar properties within the area What is 8 + 20?*